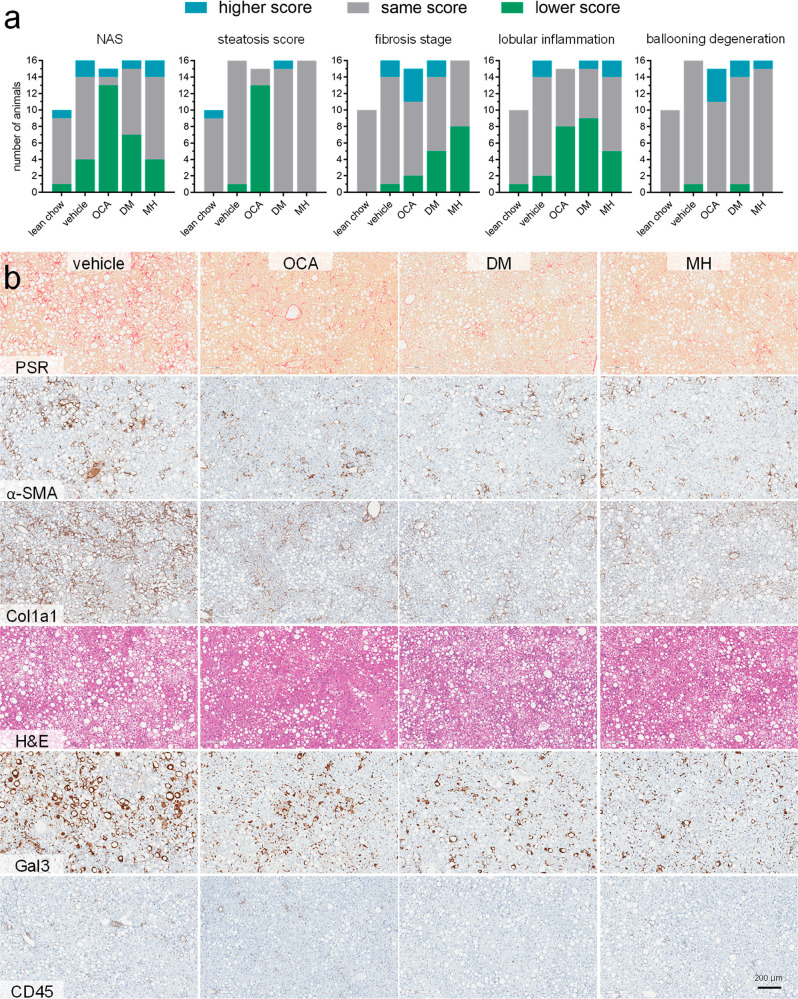
Figure 4.
NAFL-related scores and histology. (a) NAFL activity score (NAS) and individual scores for contributions by steatosis, fibrosis, lobular inflammation, and hepatocellular ballooning determined from all animals in the different treatment groups. Post-treatment scores were compared with pretreatment scores for each individual animal, and the change in the score is shown as improvement (lower score), no change, or worsening (higher score). (b) Representative immune-histochemistry images from post-treatment liver histology samples for the different treatment groups.

