
Figure 3.
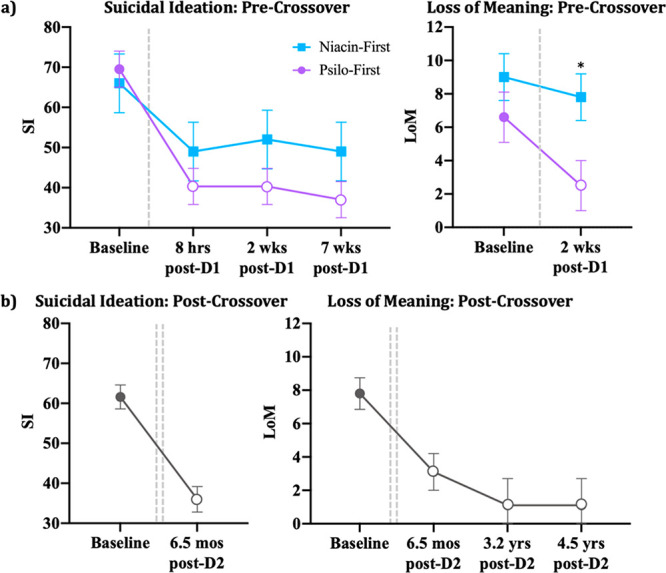
Effects of treatment on SI and LoM. (a) Mean (±SE) scores on SI and LoM at baseline and each precrossover assessment; (b) mean (±SE) scores on SI and LoM at Baseline and each postcrossover assessment. Dotted lines indicate medication sessions. Open shapes indicate a within-group difference from baseline score at p < 0.05, and * denotes a between-group difference at p < 0.05.