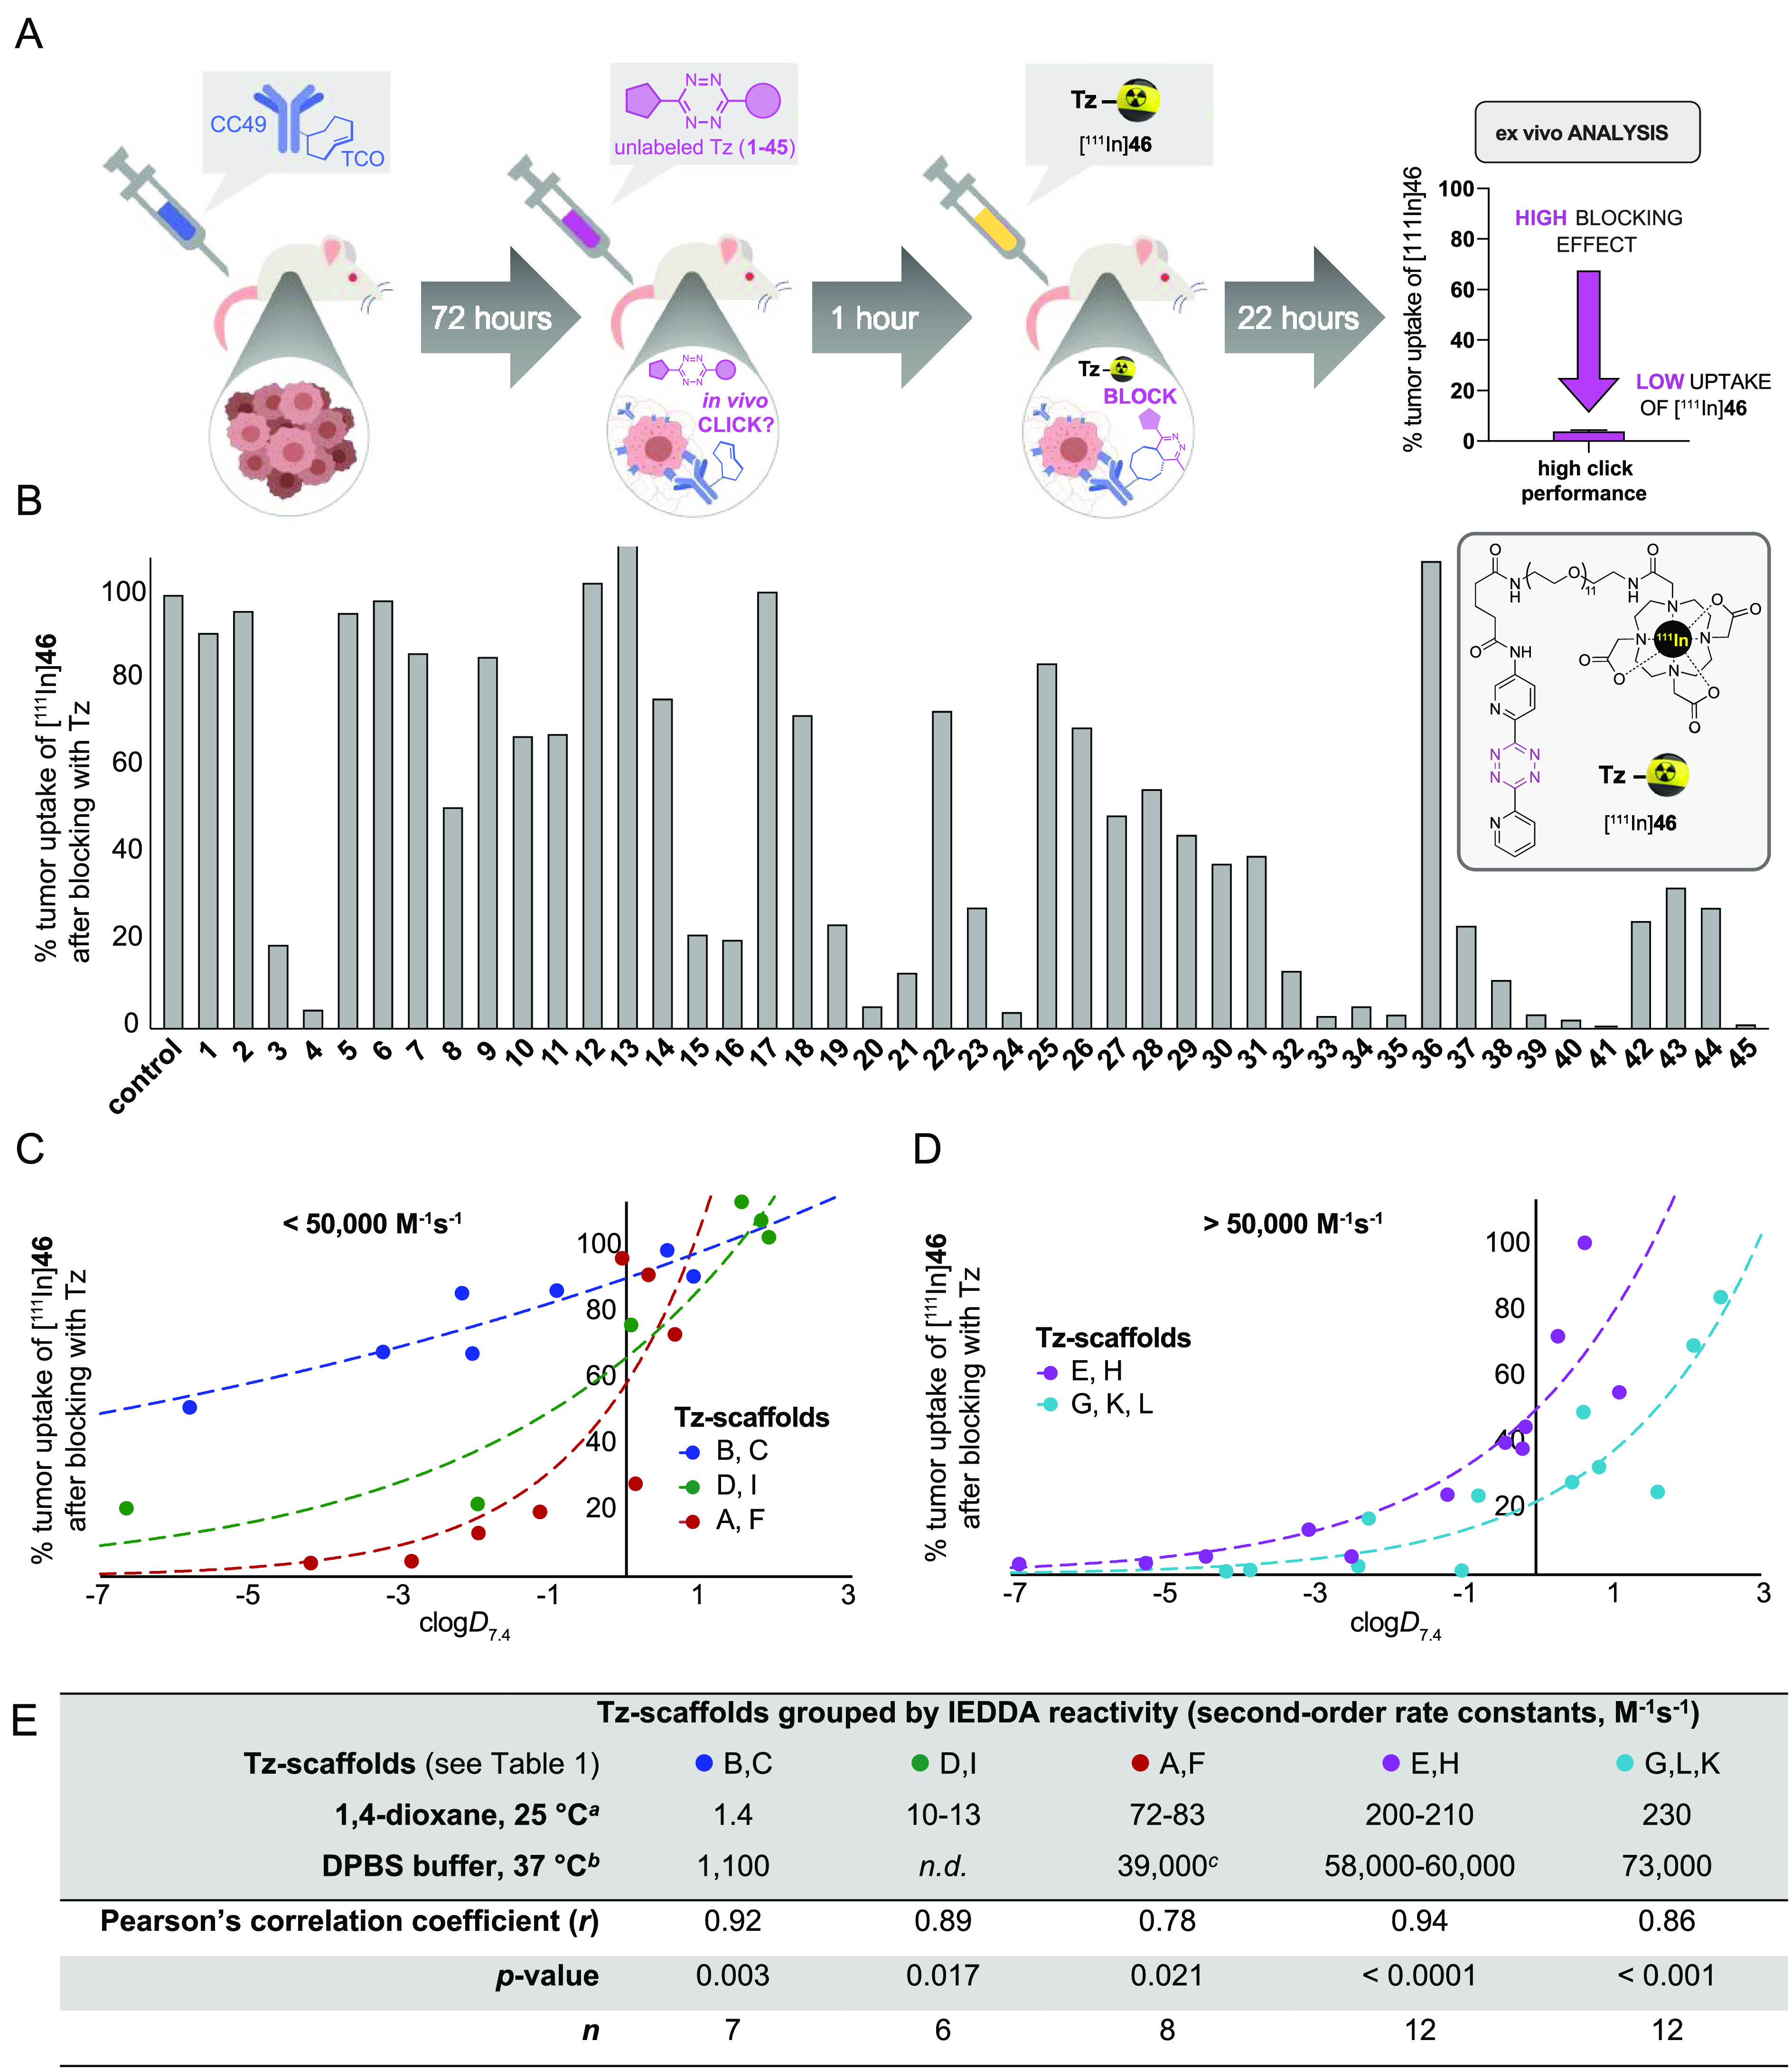
Figure 2.

Results from the blocking assay. (A) Schematic display of the blocking assay. (B) The blocking effect of nonradiolabeled Tz was determined as the change in tumor uptake of [111In]46 22 h p.i. Each Tz was administered 1 h prior to [111In]46, and the uptake was normalized to a group of animals in which no blocking was performed (control). Data represent mean from n = 3 mice/group; detailed information can be found in the SI. (C,D) Correlation of blocking effect and clogD7.4 for Tz-derivatives with similar IEDDA reactivity. Data was fitted to exponential growth equation Y = Y0ekx (dotted line). (E) Statistical analysis of the correlation between tumor uptake and clogD7.4 for the different groups of Tz-derivatives. Pearson’s correlation coefficient (r) describes the goodness of fit between the blocking effect and clogD7.4. Notes: aReaction of representative Tz with unsubstituted TCO. bReaction of representative Tz with TCO-PEG4. cMeasured for Tz-scaffold A only. n.d. = not determined.
