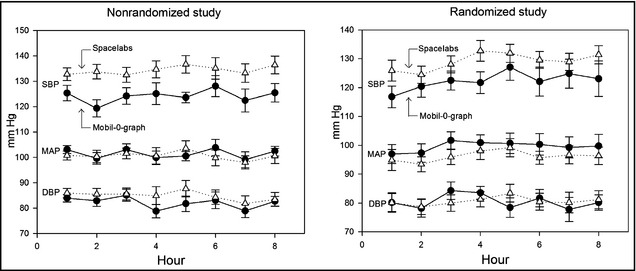
Figure 1.

Left and right insets show systolic blood pressure (SBP), mean arterial pressure (MAP), and diastolic blood pressure (DBP) averaged (with standard errors) for the 8 hours that the Mobil‐O‐Graph (black lines and filled circles) and Spacelabs (dotted lines and triangles) devices were worn in the nonrandomized and randomized studies, respectively.
