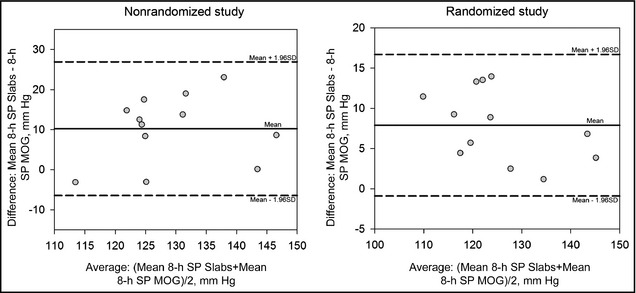
Figure 2.

Left and right insets show Bland‐Altman plots of the mean systolic pressures (SPs) of Mobil‐O‐Graph (MOG) and Spacelabs (Slabs) monitors, averaged over 8 hours for each data point for nonrandomized and randomized studies, respectively. Central solid lines indicate the mean of the differences (bias) at 10.2 mm Hg for nonrandomized study and 7.7 mm Hg for the randomized study. Dotted lines on either side of the mean indicate the confidence intervals of agreement between the two monitors' SP measurements, with a standard deviation difference of 8.5 mm Hg for nonrandomized study and 4.5 mm Hg for randomized study for all values.
