
Figure 2.
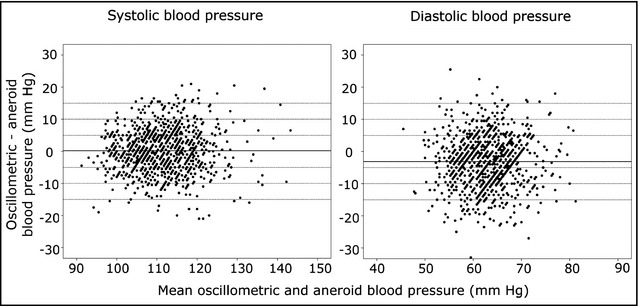
Bland‐Altman plot showing the magnitude of difference in systolic and diastolic blood pressure readings between the oscillometric and aneroid blood pressure monitors plotted against the mean of blood pressure readings with the two techniques. The solid horizontal line represents the mean blood pressure difference between the measurement methods.