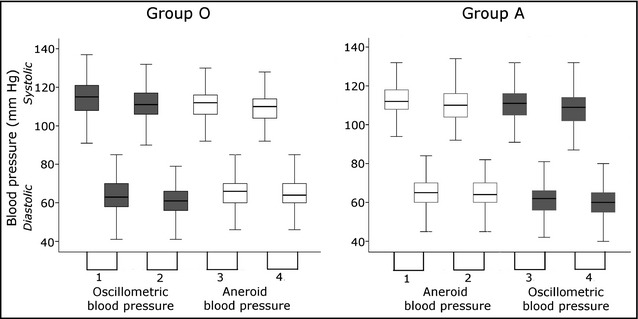
Figure 3.

Boxplot showing the four sequential systolic and diastolic blood pressure readings for group O (oscillometric measurements first) and group A (aneroid measurements first). Children in group O first underwent two oscillometric and then two aneroid measurements and children in group A had their blood pressure measured by the two techniques in reverse order. The boxes show the interquartile range, the line across the box denotes the median blood pressure value, and the whiskers indicate the range of values, excluding outliers. The shaded boxes represent the oscillometric measurements and the white boxes the aneroid measurements.
