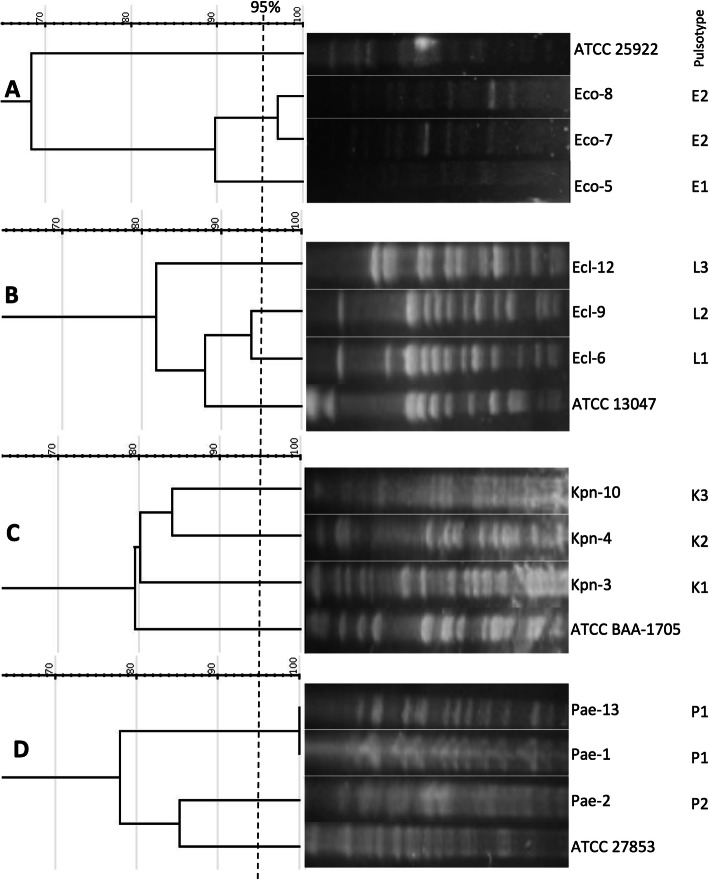
Fig. 1.
Dendrograms obtained from the analysis of PFGE patterns. Panels correspond to E. coli (a), E. cloacae (b), K. pneumoniae (c), and P. aeruginosa (d) isolates. Dendrograms were constructed using the Dice coefficient and unweighted pair group method with arithmetic mean (UPGMA). The 95% similarity cut-off is indicated with a dashed line. A standard ATCC strain of each species was included in every analysis. Pulsotypes for each isolate are indicated in the right column. Lanes that were non-adjacent in the original gel were cropped to be positioned according to dendrogram order. The unprocessed gel photographs are shown in Supplementary Fig. S1

