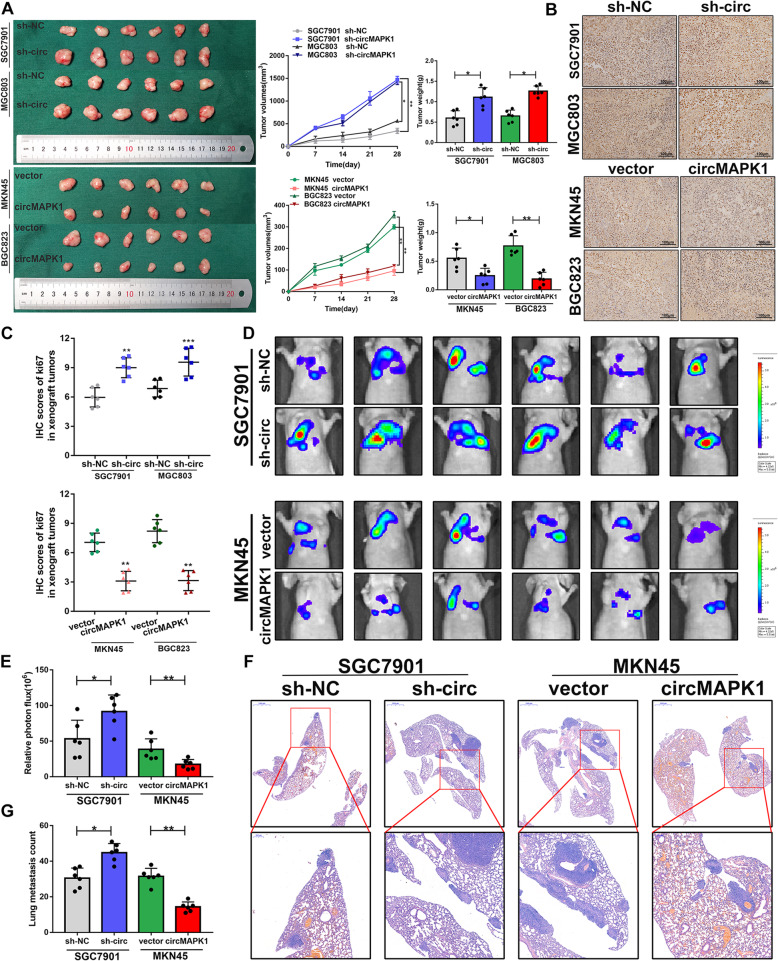
Fig. 3.
The suppressive function of circMAPK1 in vivo. a Left panel: The designated tumor cells were injected subcutaneously into nude mice, and xenograft tumors were collected 28 days later. Middle panel: Tumor volume was measured and calculated every week. Right panel: Tumor weight was measured after 28 days. b The tumor tissues were stained with Ki67 antibody. Scale bar: 100 μm. c IHC scores of Ki67 in respective xenograft tumor tissues. d Bioluminescence imaging and e Quantification of lung metastasis after injecting tumor cells into the tail vein of nude mice. f Representative images and G Quantification of H&E staining of the mouse lung metastasis. Scale bar: 1000 μm. Graph represents mean ± SD; *p < 0.05, **p < 0.01, and ***p < 0.001

