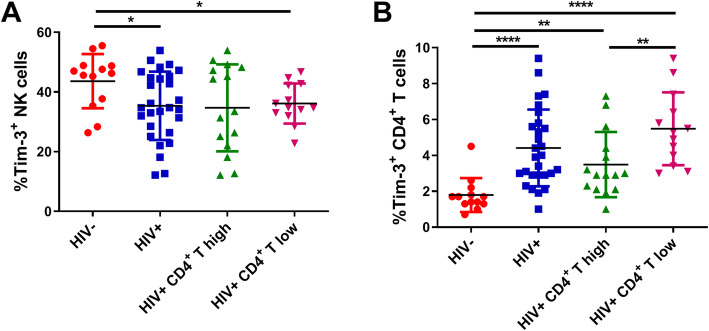
Fig. 1.
Tim-3 expression on NK cells and CD4+ T cells in HIV−, HIV+, HIV+ CD4+ T cell high, and HIV+ CD4+ T cell low groups. a The percentage of Tim-3 expression on NK cells (HIV−, n = 13; HIV+, n = 28; HIV+ CD4+ T cell high, n = 15; and HIV+ CD4+ T cell low, n = 13). b The percentage of Tim-3 expression on CD4+ T cells in each of the four groups (HIV−, n = 13; HIV+, n = 28; HIV+ CD4+ T cell high, n = 15; and HIV+ CD4+ T cell low n = 13). All data analysis was performed using GraphPad Prism 9.0 software (URL: www.graphpad.com). A Mann–Whitney test was used to compare groups; *p < 0.05, **p < 0.01, ***p < 0.001, ****p < 0.0001

