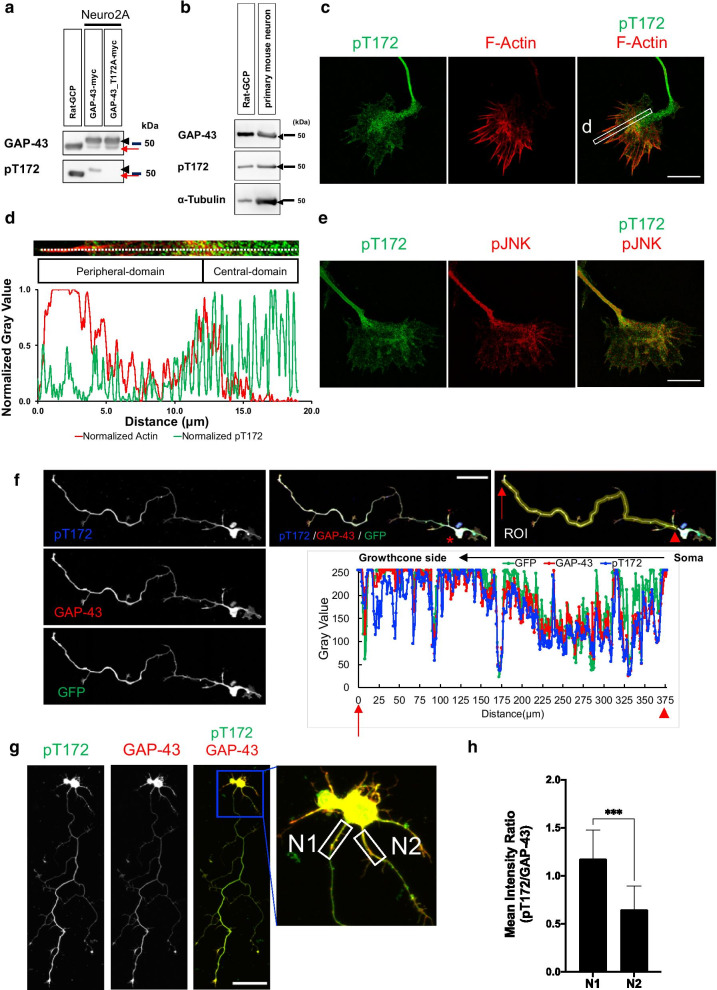
Fig. 1.
pT172Ab specifically reacted with phosphorylated T172 of GAP-43. a pT172Ab recognized the phosphorylated form of GAP-43 in the lysate of Neuro 2A cells that were transfected with wild-type GAP-43 construct, but the Ab did not recognize mutant T172A GAP-43. GCP: rat growth cone particle lysate (0.8 μg). Arrowhead: overexpressed GAP-43; arrow (red): endogenous GAP-43 of Neruo 2A cells. b Immunoblotting showed that pT172Ab reacted with rat GCP [12, 13] and the lysate of E15 cultured mouse cortical neurons (3 days in vitro (DIV3)). Arrowheads: GAP-43, pT172, and α-tubulin immunoreactivity. c SIM super-resolution imaging of pT172Ab staining of phospho-GAP-43 T172 showed enriched expression in the C-domain compared to the P-domain. The white box indicates the ROI that was measured in (d). d Quantitative distribution of the ROI in (c) by measuring the fluorescence intensity along the white dashed line from the filopodial tip. Each fluorescence intensity of F-actin and of pT172 was measured by gray value, and the maximum value of each fluorescence was set to 1.0 for standardized and normalized measurement. e Colocalization of pT172 and phospho-JNK (pJNK) observed using SIM super-resolution microscopy. They were mainly located in the C-domain and partially in filopodia. Scale bar: 10 μm. f Z-stack maximum-intensity projection images of the mouse hippocampal neurons. Immunofluorescence using Abs of pT172 and GAP-43. Upper right: ROI of the gray values from the soma to the growth cone of (f) (lower graph). Lower graph: quantitative distribution of the ROI along the cell body to the growth cone. Arrowheads: growth cone. Arrows: neuronal soma. g Immunofluorescent studies of cultured mouse hippocampal neurons (DIV3) using pT172 (green) and pan-GAP-43 Abs (red). Magnified images of DIV 3 mouse hippocampal neuronal soma with several neurites. White boxes indicate ROIs that were measured. N1: longest neurite; N2: second longest neurite. Scale bar: 50 μm. h Means of the staining intensity ratios (pT172 vs. GAP-43) in neurites (of g; rightmost). Values are expressed as means ± SD; n = 10; Paired t-test; ***p < 0.001. Immunofluorescent experiments were performed using mAb against pT172

