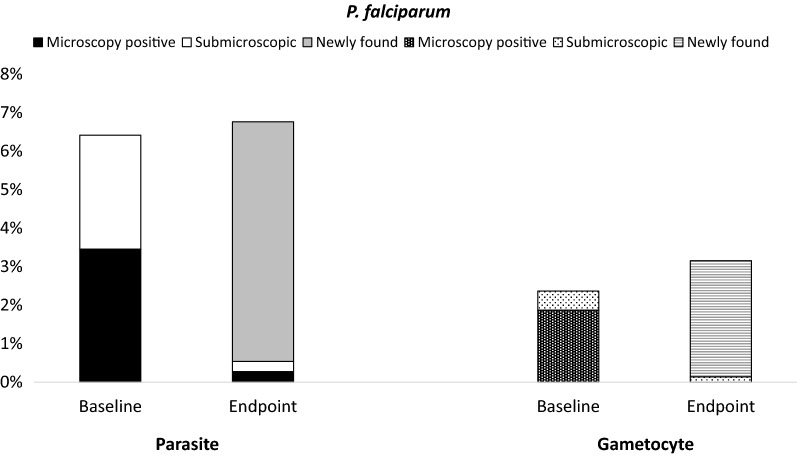
Fig. 4.
Dynamics of parasite and gametocyte in P. falciparum at baseline and endpoint. At baseline, P. falciparum prevalence was 6% (52/811) by microscopy and/or PCR. Half of these 52 subjects were positive by microscopy thus treated (54% = 28/52, ■), and 46% (24/52) were submicroscopic and untreated (□). At the endpoint, only two of each microscopic and submicroscopic group were positive. However, 46 subjects other than the mentioned groups were detected positive by microscopy (n = 32) or PCR (n = 14) ( ). Forty of these 46 subjects had data at baseline: 73% (n = 29) were parasite negative and 27% (n = 11) were infected with other species (P. vivax). Furthermore, similar pattern was observed in gametocyte. At baseline, gametocyte prevalence was 2% (19/803). Seventy-nine percent (15/19) had microscopic parasite and treated (
 ), and 21% (4/19) had submicroscopic thus untreated (
 ). At the endpoint, only one submicroscopic parasite remained positive. However, 22 subjects other than the mentioned groups were positive for gametocyte (
 ). Twenty of these 22 subjects were negative at baseline while two had no data

