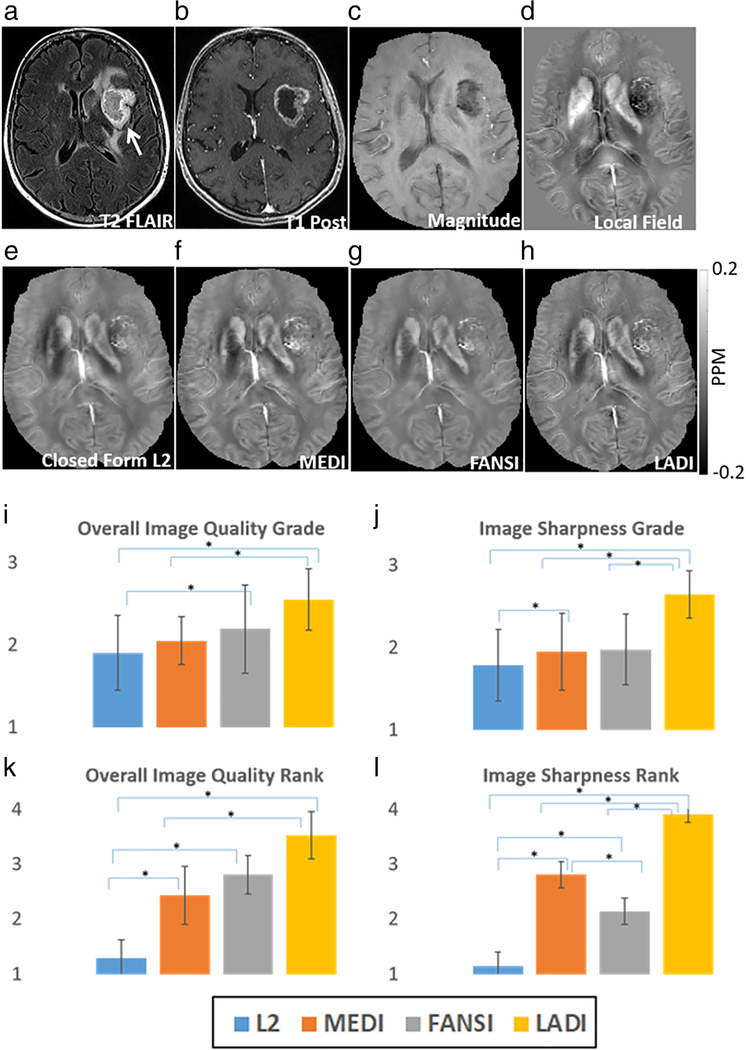
FIGURE 2:
Reconstruction of susceptibility maps from hemorrhagic tumor data. The location of the tumor is indicated by the white arrow in the T2 FLAIR image (a), T1 postcontrast image (b), and the magnitude image (c). (d) Tissue field used to reconstruct the QSM maps. Compared to (e) closed form L2, (f) MEDI and (g) FANSI reconstructions; (h) LADI reconstructions have sharper edges and better tumor vasculature conspicuity. (i–l) The average scores from numerical grading and numerical ranking of images for overall image quality, and image sharpness. Pairs for which a significant (P < 0.05) difference was seen in the median scores are indicated using an asterisk.

