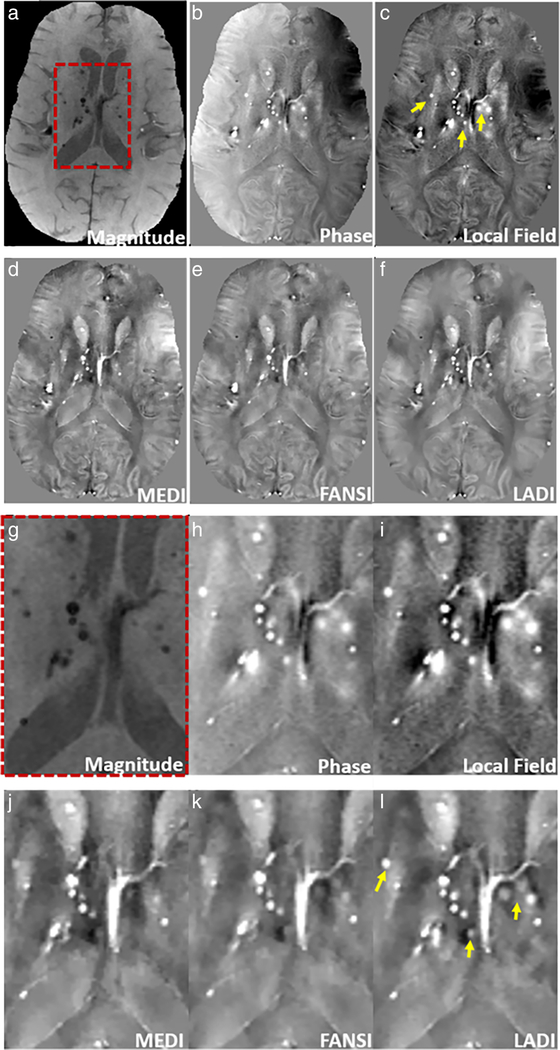
FIGURE 3:
Reconstruction of susceptibility maps from a patient with microbleeds. (a) The magnitude image, (b) unwrapped phase image, (c) local field, and reconstructions using (d) MEDI, (e) FANSI, and (f) LADI are shown. Microbleeds have better conspicuity on the phase image (b) and local field (c) image as compared the magnitude image (a). Microbleeds appear sharper and are better visualized on the LADI reconstructions (f) as compared to MEDI (d) and FANSI (e) reconstructions, locations shown by arrows on the local field map (c). (g–l) Zoomed-in image of a small region (indicated by the dashed red box in (a)).

