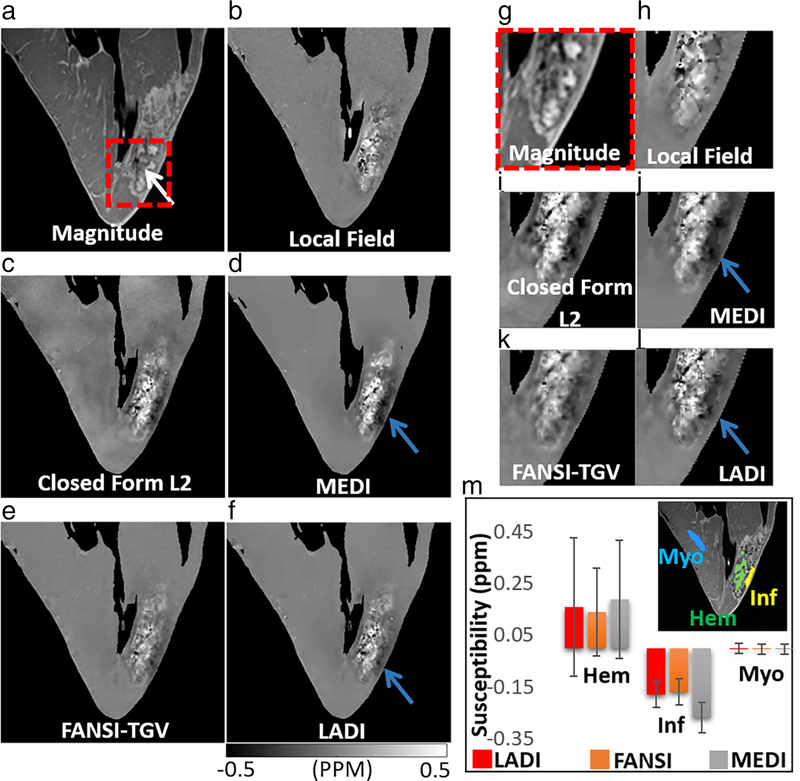
FIGURE 4:
Quantitative susceptibility mapping on an ex vivo large animal model of reperfusion injury myocardial infarction. (a) Magnitude image with the location of the hemorrhage indicated by a white arrow, and (b) local field. The dark artifact visible in (c) closed form L2 and (d) MEDI reconstructions is reduced in (e) FANSI-TGV and (f) LADI reconstructions (location indicated by blue arrow). (g–l) Zoomed-in image of a small region indicated by the dashed-red box in (a). (m) Comparison of mean susceptibilities calculated from the hemorrhage (Hem), infarct (Inf), and remote myocardial (Myo) regions.

