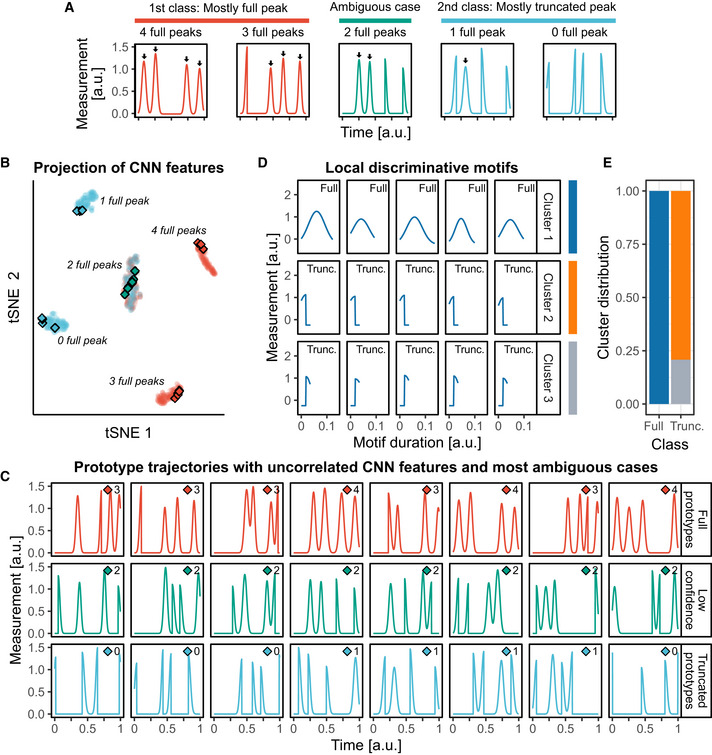
Figure EV1. CNN highlights discriminative dynamics motifs in synthetic data.

- A synthetic dataset resembling pulsatile signaling activities was created, and a CNN was trained to recognize its two classes (see Materials and Methods and Appendix Note 2). Each trajectory comprises four pulsing events that consist of either full Gaussian peaks or half‐truncated Gaussian peaks. Events are triggered at random locations but with a minimal distance from each other. The class labeled “Full” displays predominantly full peaks (2, 3, or 4), while the class labeled “Truncated” displays predominantly truncated Gaussian peaks (0, 1, or 2 full peaks).
- t‐SNE projection of the CNN features of the trajectories in the validation set. Each cluster of points regroups trajectories based on their number of full peaks. Diamonds indicate prototype trajectories.
- Prototype trajectories (blue and red) sampled by selecting trajectories whose CNN features were uncorrelated (see Materials and Methods), and trajectories for which the model confidence is lowest (green). Trajectories are the ones indicated with diamonds in (B). The number of full peaks in each trajectory is indicated next to the diamond symbol. The minimal threshold of model confidence to sample prototypes was set to 90%.
- Motifs extracted with the CAM method (see Materials and Methods). Motifs were clustered with DTW distance and Ward linkage. Representative medoid motifs of the clusters are shown. The class of the trajectory from which the motif was extracted is indicated in the top‐right corner.
- Distribution of the motifs in the clusters according to the class of their origin trajectory.
