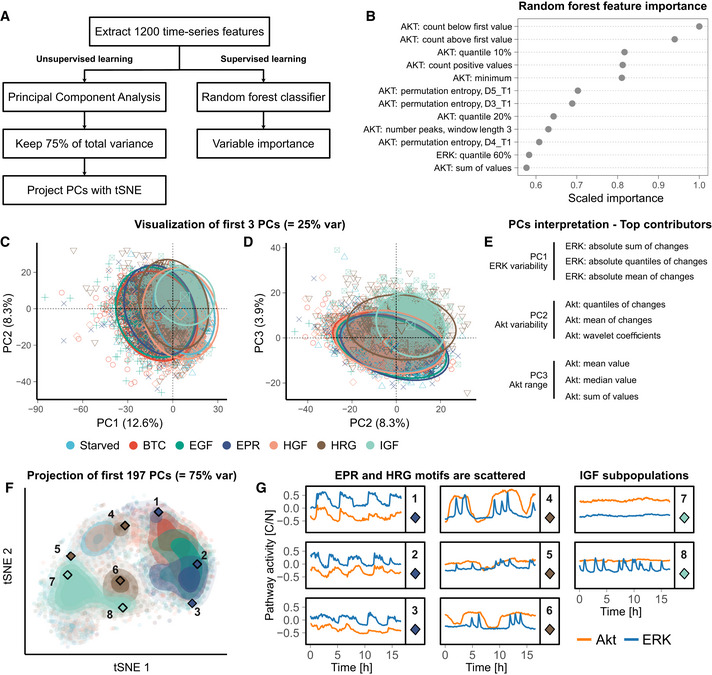
Figure 3. Classic machine‐learning workflows for time series exploration provide a more coarse‐grained overview of ERK/Akt signaling landscape than CODEX.

-
ASchematic of the two workflows used for analyzing ERK/Akt signaling in response to GFs.
-
BFeature importance of a random forest trained to classify ERK/Akt time series according to the GF treatments. The 12 most important features are shown. The signaling pathway (ERK or Akt) associated with each feature is indicated. For the permutation entropy, the parameters are as follows: D length of the subwindows and T lag between the windows (Christ et al, 2018).
-
C, DBiplots of the first three principal components derived from the time series features PCA. Each symbol represents an individual trajectory. The circles indicate normal ellipses for each group with a confidence of 95%. The larger symbols in the middle of the ellipses are visual helps for the identification of the groups. The percentiles in the axis labels indicate the amount of total variance carried by the principal components.
-
EFeatures that contributed the most to the three first principal components (see Materials and Methods).
-
Ft‐SNE projection of the first 197 principal components, which carry 75% of the total variance of the features. Each point represents an individual trajectory; shading indicates point density. The diamond symbols indicate the trajectories shown in (G).
-
GManually selected trajectories which are highlighted with a diamond symbol and a label in (F).
