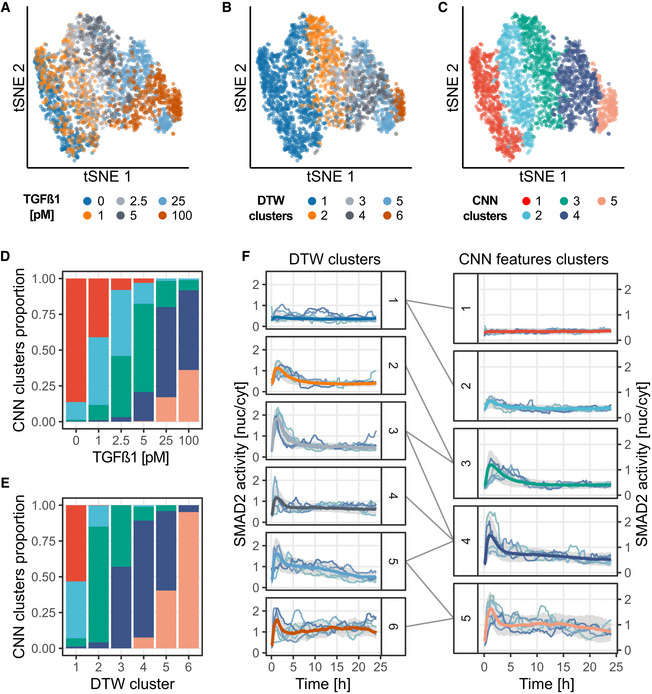
Figure 4. CODEX identifies TGFβ dose‐dependent signaling states.

MCF10A cells were exposed to increasing doses of TGFβ, and single‐cell SMAD2 responses were recorded using a fluorescent biosensor (Strasen et al, 2018). A CNN was trained to classify SMAD2 activity trajectories according to the TGFβ dose.
-
A–Ct‐SNE projection of the CNN latent features for the training, validation, and test sets pooled together. Trajectories representations are colored according to: the TGFβ dose (A), the DTW clusters (B), or the CNN features clusters (C). The DTW clusters are the ones of the original study (Strasen et al, 2018). CNN features were clustered using L1 distance and partitioned with hierarchical clustering and Ward linkage.
-
D, EDistribution of the trajectories in the CNN features clusters according to their corresponding TGFβ dose (D) and their DTW cluster (E). Same colors as in (C).
-
FComparison of DTW clusters and CNN features clusters. Median trajectories for each cluster (see Materials and Methods) are reported in bold colored lines, colors matching (B) and (C), gray shade indicate interquartile range. The DTW clusters (1–6) are made of (946, 340, 200, 278, 218, 83) single‐cell trajectories, respectively. The CNN clusters (1–5) are made of (505, 429, 451, 492, 188) single‐cell trajectories, respectively. A random sample of trajectories for DTW clusters and the centroid trajectories (see Materials and Methods) for each CNN features cluster are shown.
