
Figure 5. CODEX identifies cell line‐specific p53 responses under increasing ionizing radiation doses.
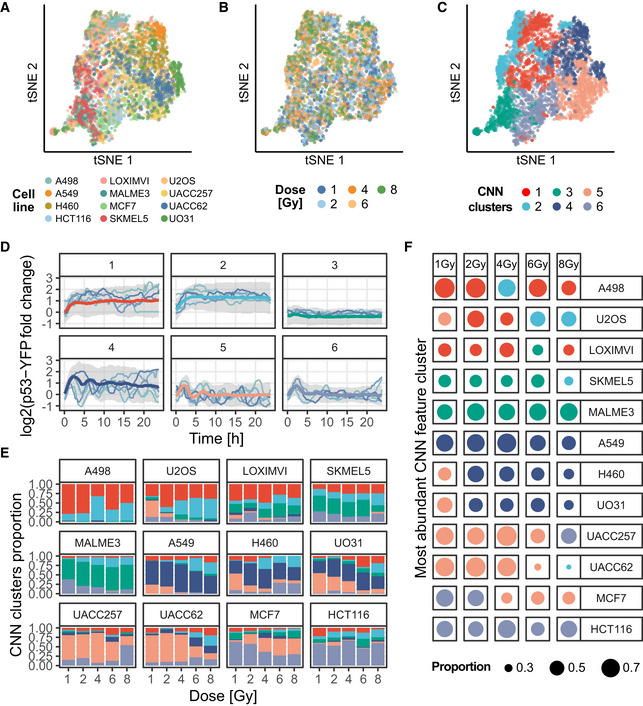
12 different cell lines were exposed to five doses of ionizing radiations, and single‐cell p53 responses were reported using a fluorescent reporter (Stewart‐Ornstein & Lahav, 2017). A CNN was trained to recognize the combination of cell line and radiation dose from p53 trajectories (i.e., one out of 60 classes; see Materials and Methods and Appendix Note 4).
-
A–Ct‐SNE projection of the CNN features for the training, validation, and sets pooled together. Trajectories representation is colored according to: the cell lines (A), the ionizing radiation doses (B), or the CNN features clusters (C). The p53 trajectories were clustered according to their standardized CNN features with L1 distance and partitioned with hierarchical clustering and Ward linkage.
-
DRepresentative p53 trajectories of the clusters identified using CNN features clustering. Median trajectories are reported in bold colored lines, colors matching (C), gray shade indicates interquartile range. The CNN clusters (1–6) are made of (767, 554, 486, 574, 746, 698) single‐cell trajectories, respectively. Data are pooled from two to three replicates for each cell line. Individual traces indicate the medoid p53 single‐cell trajectories for each cluster (see Materials and Methods).
-
EDistribution of the trajectories in the CNN feature clusters according to cell lines and ionizing radiation doses. Same colors as in (C).
-
FMost abundant CNN features cluster for all trajectories in each combination of cell line and radiation dose combinations. The color of the dot indicates the most abundant cluster; the size of the dot indicates the proportion of cells classified in the indicated cluster. Same colors as in (C).