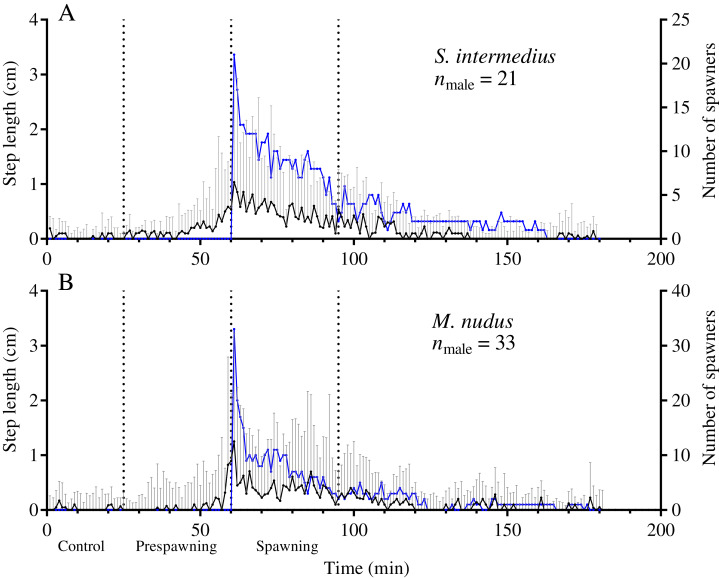
Figure 4. Temporal dynamics of the locomotion activity of males that started to spawn first during mass spawning (leading males).
(A) Strongylocentrotus intermedius. (B) Mesocentrotus nudus. The data on the step lengths of leading males and the numbers of spawners were combined into corresponding pools and aligned on the X-axis at the time point coinciding with the beginning of spawning of each male. Vertical dashed lines denote the boundaries of the control, prespawning and spawning intervals. The black solid line denotes the median step length of sea urchins. Vertical lines indicate the interquartile range (IQR). The blue line indicates the number of spawning males (n).

