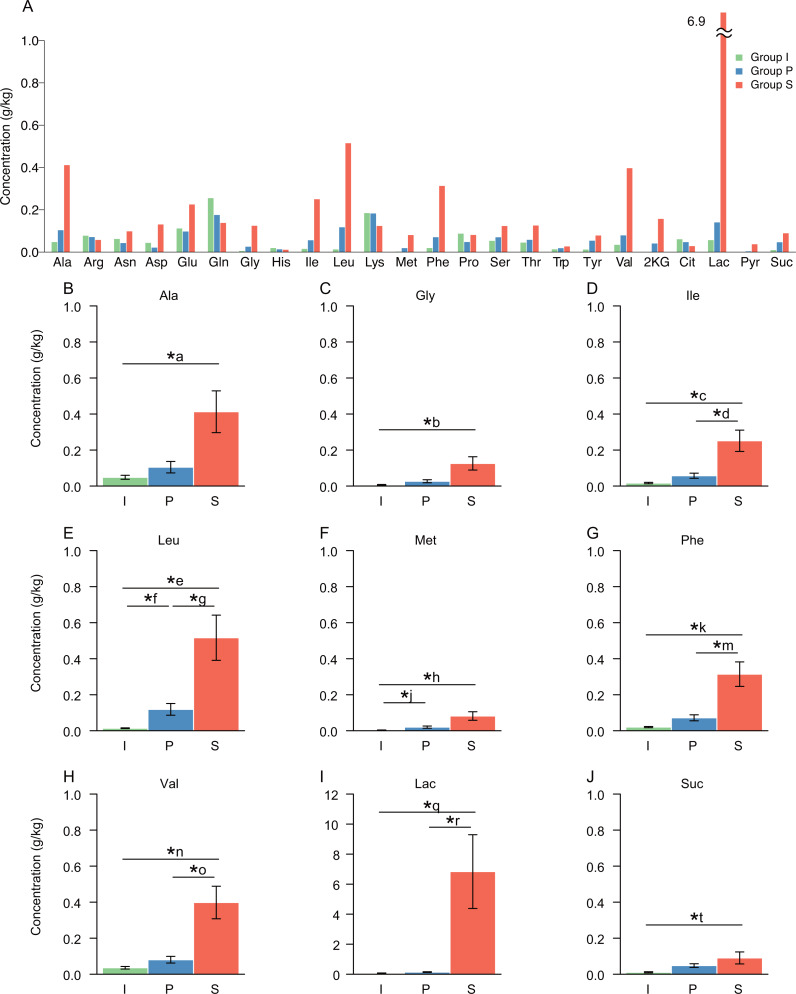
Figure 3. Concentrations of free amino acids and organic acids.
(A) All metabolites measured. (B) Metabolites with significant difference in average concentrations among the processes. Error bars indicate the standard error. *, significant difference (P < 0.05) with Bonferroni correction for multiple testing. I, initial raw vegetable group (n = 8); P, pretreatment group (n = 8); S, salt stock preparation group (n = 8). Ala, alanine; Arg, arginine; Asn, asparagine; Asp, aspartic acid; Glu, glutamic acid; Gln, glutamine; Gly, glycine; His, histidine; Ile, isoleucine; Leu, leucine; Lys, lysine; Met, methionine; Phe, phenylalanine; Pro, proline; Ser, serine; Thr, threonine; Trp, tryptophan; Tyr, tyrosine; Val, valine; 2KG, 2-ketoglutaric acid; Cit, citric acid; Lac, lactic acid; Pyr, pyruvic acid; Suc, succinic acid. P-values for metabolites with significant difference were as followed: *a, 0.001; *b, 0.001; *c, 0.0002; *d, 0.002; *e, 0.0002; *f, 0.010; *g, 0.007; *h, 0.010; *j, 0.010; *k, 0.0002; *m, 0.001; *n, 0.0002; *o, 0.001; *q, 0.0002; *r, 0.0002; *t, 0.005.

