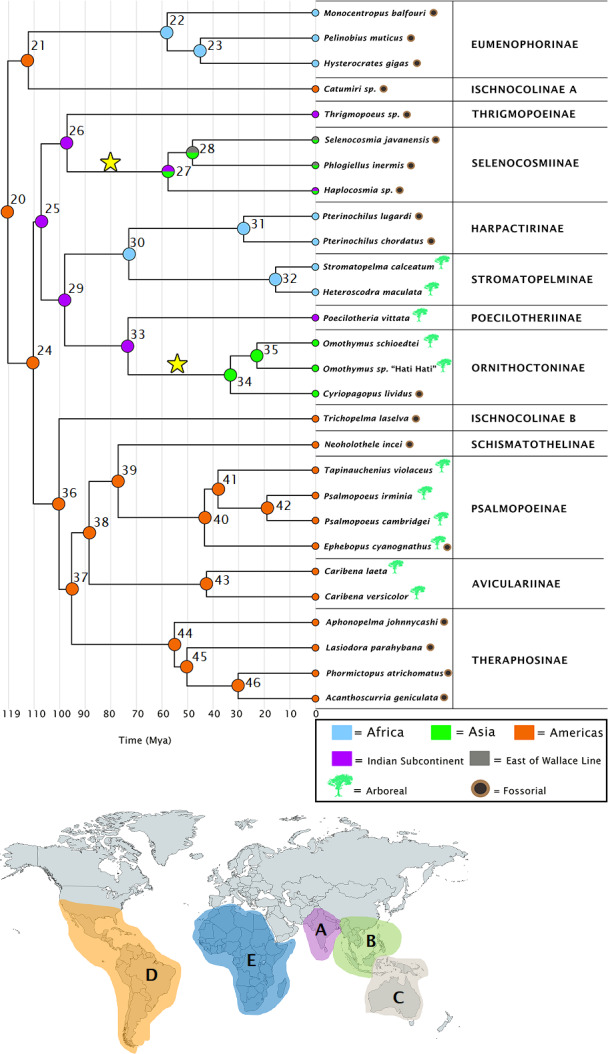
Figure 1. Ancestral ranges as estimated under the DEC+j model.

Subfamilies are given for each species, along with a timescale in millions of years. Node numbers are provided, and each node is color coded to correspond with the areas highlighted on the map. Letters on the map correspond to range codings given in the Methods section. The stars on the tree represent independent colonizations of Asia by theraphosids, having arrived there from the Indian Subcontinent. Map credit: https://mapchart.net/, 2021. Licensed under CC BY 4.0 SA.
