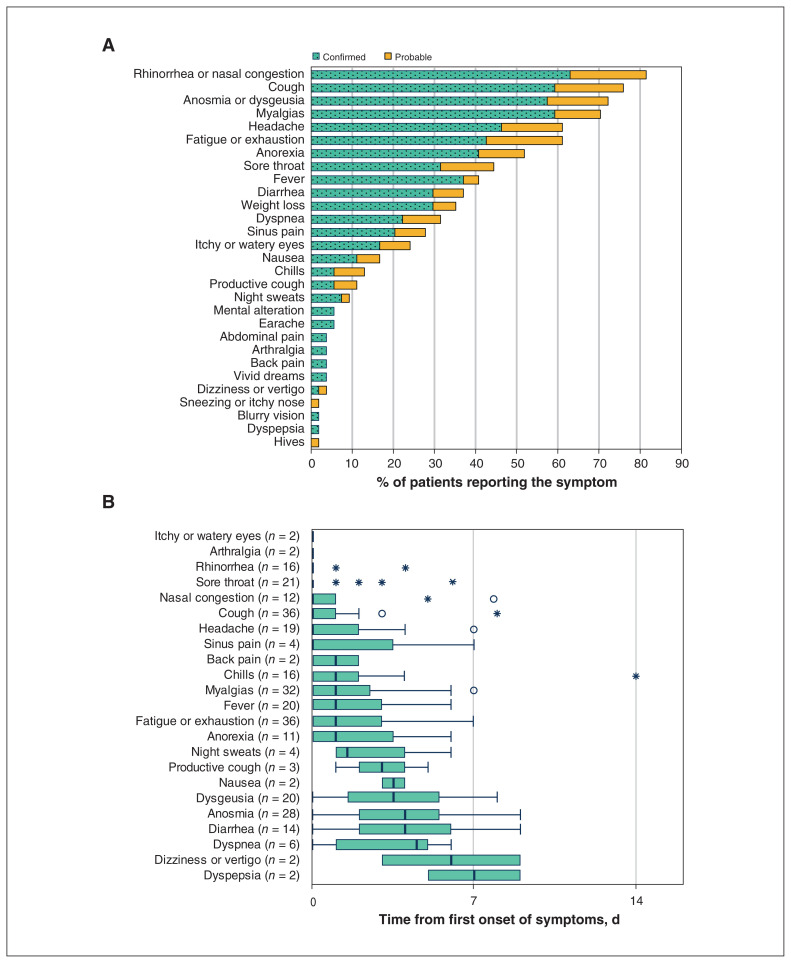
Figure 3:
(A) Frequency of symptoms among confirmed (n = 40) and probable cases (n = 14) of coronavirus disease 2019 (COVID-19). (B) The median onset of common symptoms among confirmed and probable cases. Note: Data presented in Figure 3B include only those participants who recalled the precise onset and resolution of their symptoms. Dysgeusia (altered taste) includes 18 with ageusia (loss of taste). Box and whiskers plots show the medians and interquartile ranges (IQRs). Outliers within 3 × IQR (open circles) or outside (*).

