
Figure 1. hPSC-LOs are permissive to SARS-CoV-2 virus infection both in vitro and in vivo.
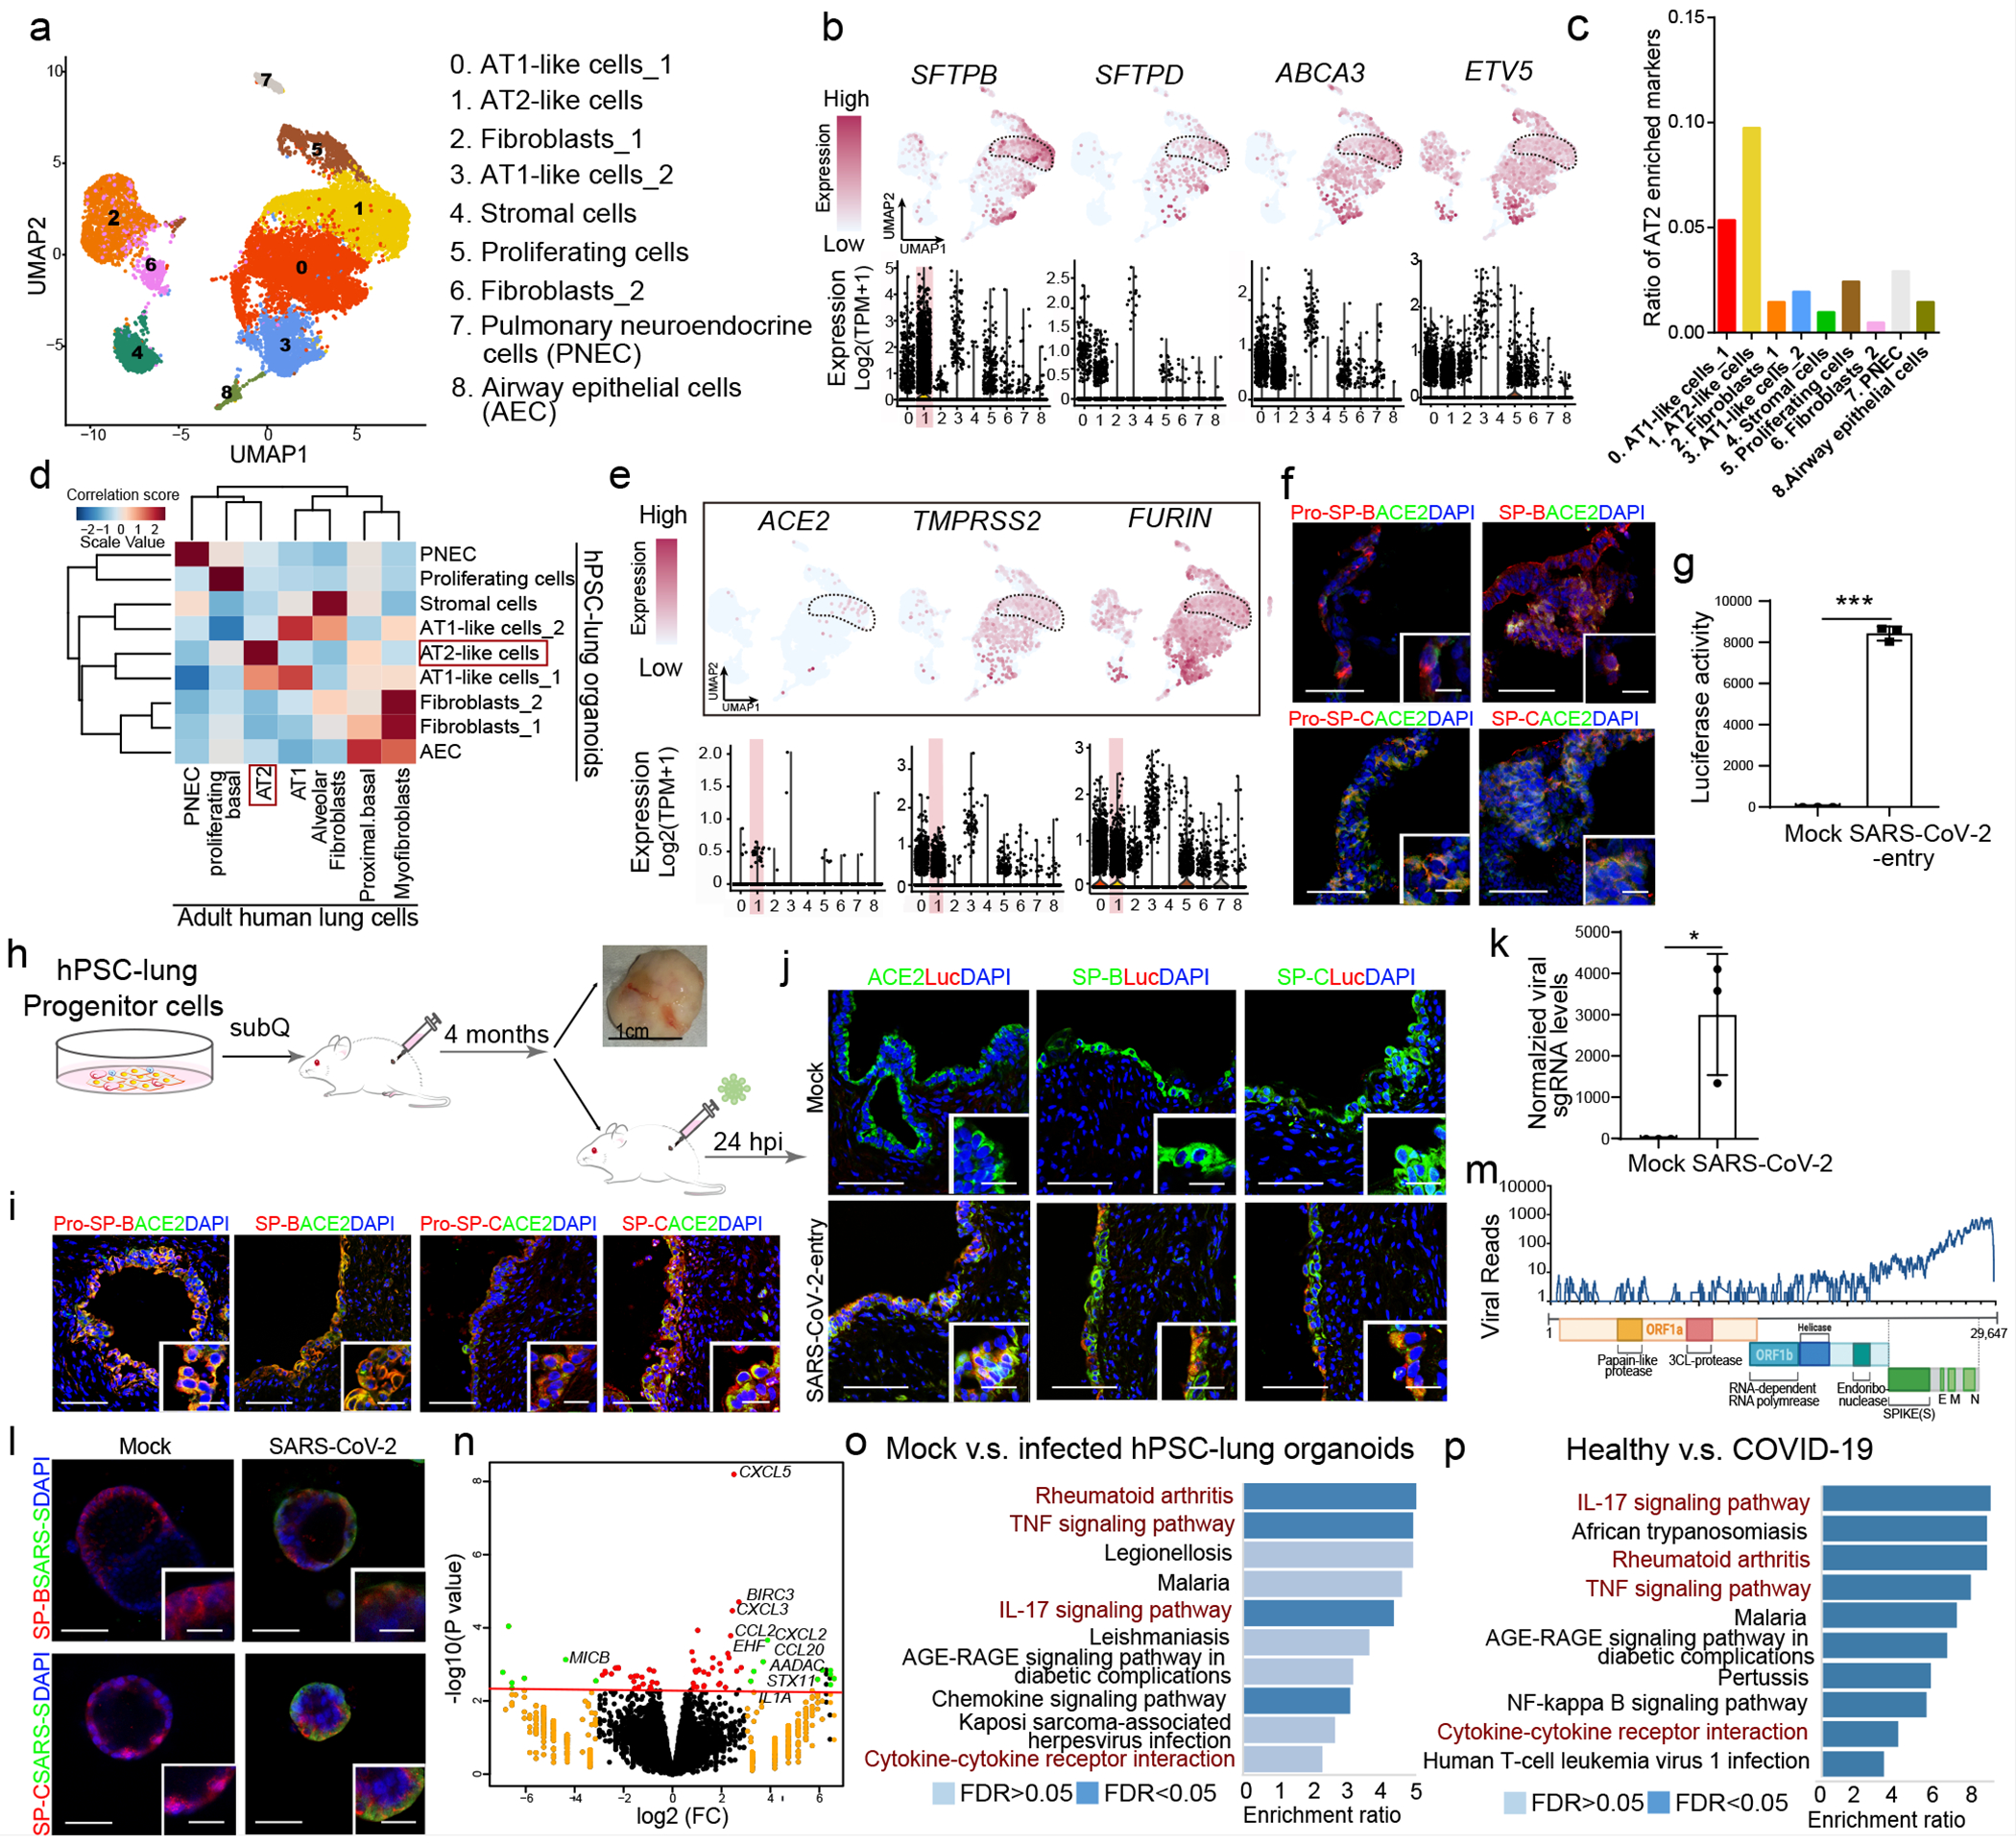
a. UMAP of hPSC-LOs. b. AT2 cell markers in each cluster in UMAPs. c. Enrichment analysis of hPSC-LOs using genes highly expressed in adult human AT2 cells. d. Correlation analysis of genes with cell fates in hPSC-LOs and adult human lung cells. e. UMAP of ACE2, TMPRSS2 and FURIN expression in hPSC-LOs. f. Immunostaining of hPSC-LOs. Scale bars= 30 μm. Microscale bars=10 μm. g. Luciferase activity at 24 hpi of hPSC-LOs either mock-infected or SARS-CoV-2-entry virus infected (MOI=0.01). n=3 biological independent experiments. ***P=1.62E-06. h. Schematic of in vivo transplantation of hPSC-derived lung xenografts. i, Immunostaining of hPSC-derived lung xenografts. Scale bars=75 μm. Microscale bars=10 μm. j, Immunostaining of hPSC-derived lung xenografts at 24 hpi (1X10⁴ FFU). Scale bars= 75 μm. Microscale bars=10 μm. k, qRT-PCR analysis of total RNA extracted from infected hPSC-LOs (24 hpi, MOI=0.01) for viral N sgRNA. n=3 biological independent experiments. *P=0.0236. l, Immunostaining of hPSC-LOs at 24 hpi (SARS-CoV-2, MOI=0.01). Scale bars= 50 μm. Microscale bars=10 μm. m, Alignment of the transcriptome with the viral genome in SARS-CoV-2 infected hPSC-LOs. Schematic below shows the SARS-CoV-2 genome. n, Volcano plot analysis of differential expression of SARS-CoV-2 infected hPSC-LOs versus mock infection. Red line indicates p-adjusted value<0.05. o, Gene over-representation analysis using KEGG pathway database of SARS-CoV-2 infected hPSC-LOs versus mock infection. n=3 biological independent experiments. p. Gene over-representation analysis using KEGG pathway database of lung autopsy tissues from COVID-19 versus healthy patients. n=3 patients for each group. *P < 0.05 and ***P< 0.001. Data were analyzed by an unpaired two-tailed Student’s t-test and shown as mean ± STDEV. Data are representative of at least three independent experiments.