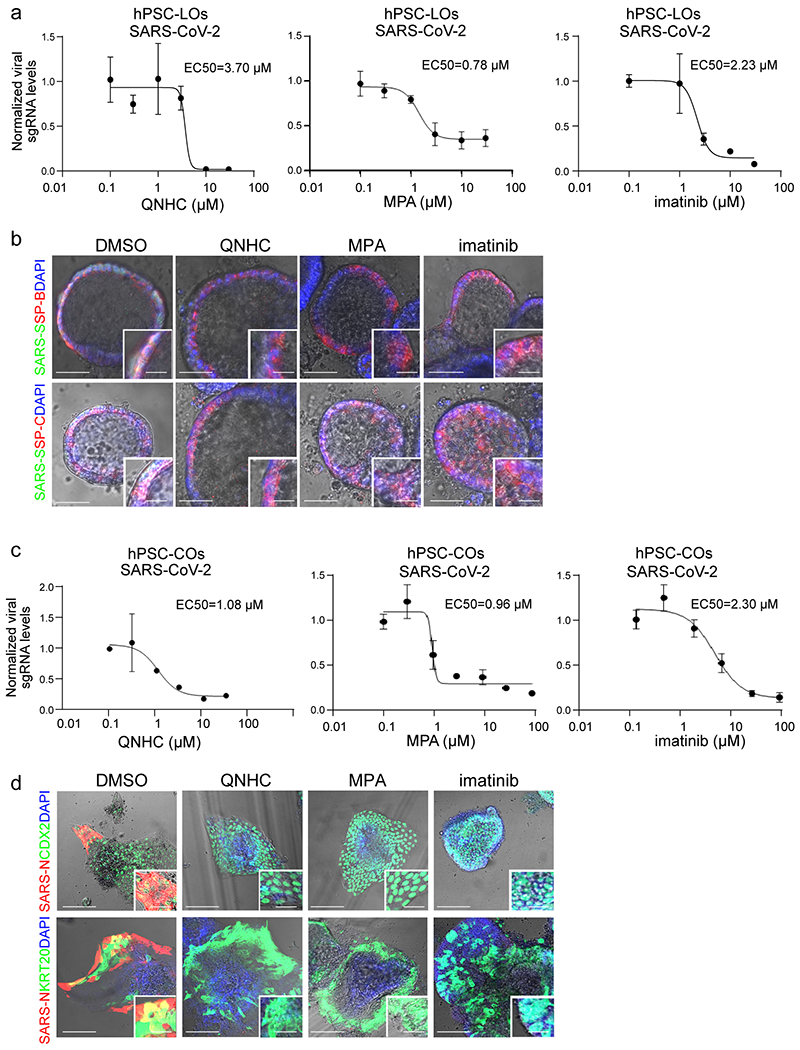
Extended Data Figure 7. Efficacy curve of imatinib, MPA and QNHC on hPSC-LOs and hPSC-COs.

a, qRT-PCR based dose curve of imatinib, MPA, and QNHC on hPSC-LOs at 24 hours post-SARS-CoV-2 infection (SARS-CoV-2, MOI=0.1). n=3 biological independent experiments. b, Bright field+immunostaining images of SARS-CoV-2 Spike protein (SARS-S) and SP-B/SP-C in imatinib, MPA, or QNHC treated hPSC-LOs at 24 hpi (MOI=0.5). Scale bar = 50 μm. Microscale bars= 15 μm. c, qRT-PCR based dose curve of imatinib, MPA, and QNHC on hPSC-COs at 24 hpi of SARS-CoV-2 (SARS-CoV-2, MOI=0.1). n=3 biological independent experiments. d, Bright field+immunostaining images of SARS-S and SP-B/SP-C at 24 hpi of hPSC-COs infected with SARS-CoV-2 virus (MOI=0.5) and three hours later followed by 10 μM imatinib, 3 μM MPA or 4.5 μM QNHC treatment. Scale bar = 50 μm. Microscale bars= 15 μm. Data are representative of at least three independent experiments.
