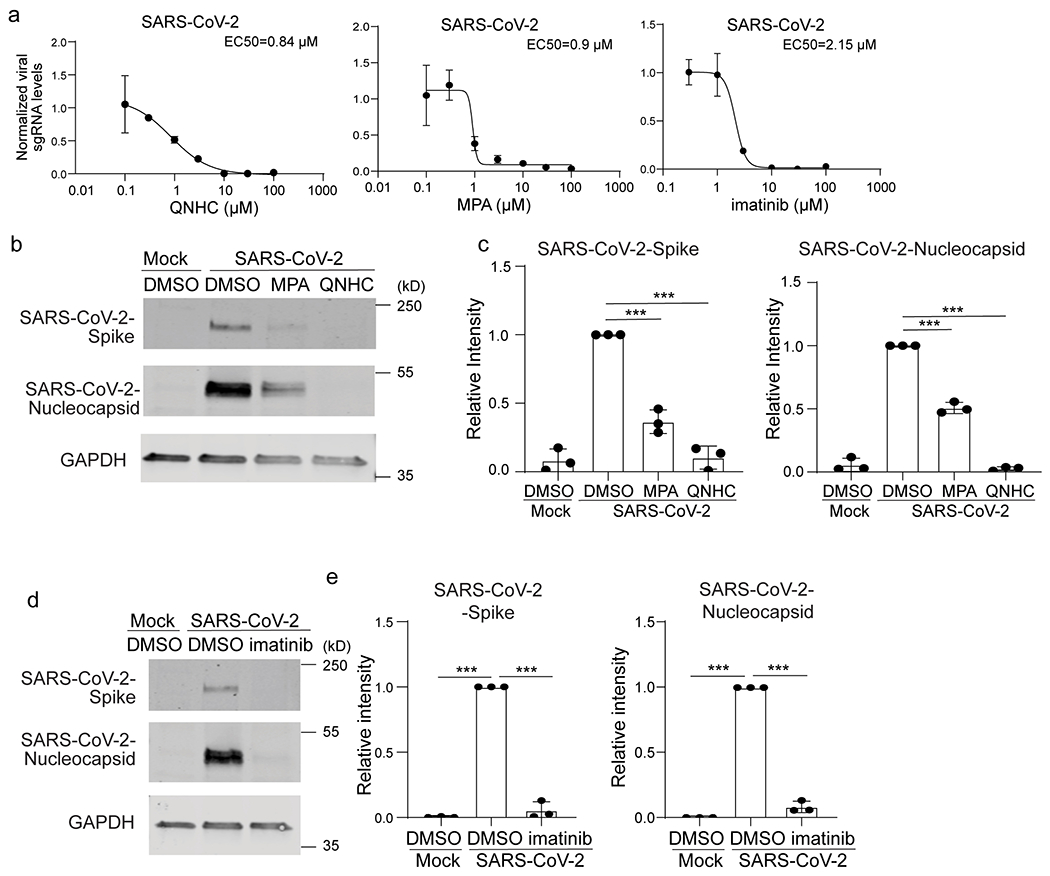
Extended Data Figure 8. Imatinib, MPA, and QNHC inhibit SARS-CoV-2 on Vero cells.

a. qRT-PCR based dose curve of imatinib, MPA and QNHC on Vero cells at 24 hours post-SARS-CoV-2 infection (SARS-CoV-2, MOI=0.01). n=3 biological independent experiments. b, c, Western blotting (b) and quantification (c) of 3 μM MPA, 4.5 μM QNHC or DMSO-treated Vero cells at 24 hours post-SARS-CoV-2 infection (SARS-CoV-2, MOI=0.01). n=3 biological independent experiments, ***P=0.000223, ***P=5.09E-05, ***P=4.32E-05. ***P=3.72E-08. d, e, Western blotting (d) and quantification (e) of DMSO or 10 μM imatinib treated Vero cells at 24 hpi (SARS-CoV-2, MOI=0.01). n=3 biological independent experiments, ***P=7.41E-18, ***P=8.06E-07, ***P=7.41E-18, ***P=3.39E-06. ***P<0.001. Data were analyzed by an unpaired two-tailed Student’s t-test and shown as mean ± STDEV. Data are representative of at least three independent experiments.
