
Figure 2. hPSC-COs are permissive to SARS-CoV-2 virus infection.
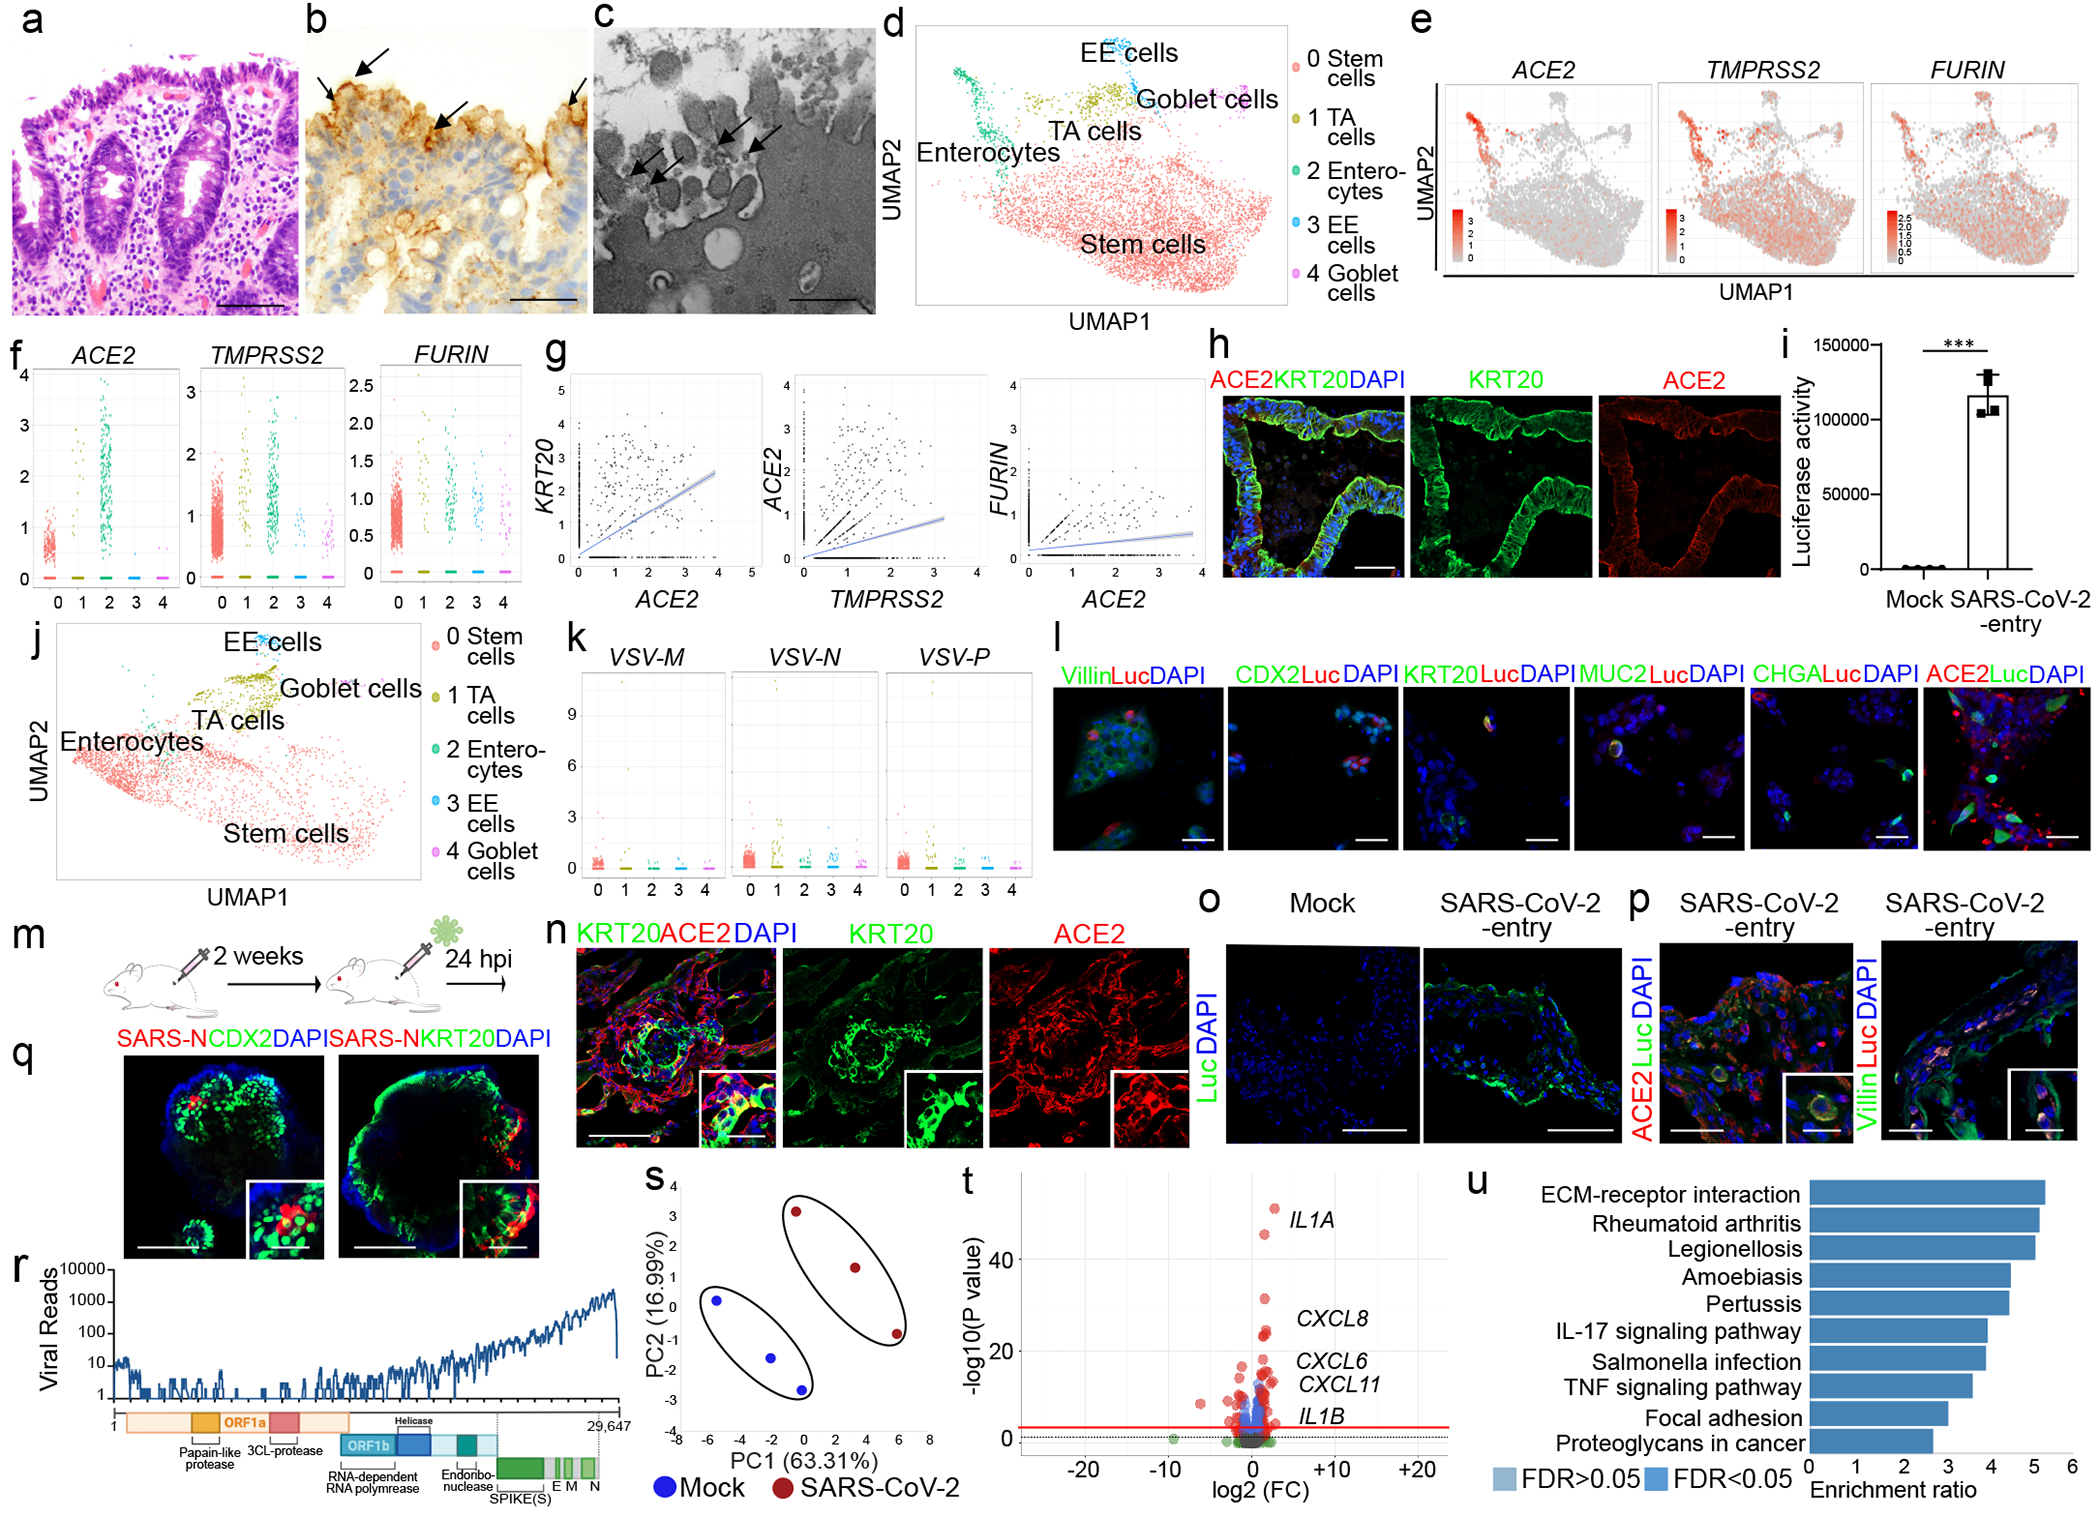
a-c, Hematoxylin and Eosin staining (a), in-situ hybridization staining for SARS-CoV-2 RNA (b) and electron microscopy (c) of colonoscopy biopsy tissue from a COVID-19 patient. Scale bar= 50 μm (a), 25 μm (b), 1 μm (c). The arrows indicate SARS-CoV-2 RNA (b), or SARS-CoV-2 viral particles (c). d, UMAP of hPSC-CO cell types. e, f, UMAP (e), and jitter plot (f) of ACE2, TMPRSS2 and FURIN. g, Correlation of expression levels for KRT20 with ACE2, TMPRSS2 and FURIN. h, Confocal images of hPSC-COs. Scale bar= 100 μm. i, j Luciferase activity (i) and UMAP (j) of COs infected with SARS-CoV-2-entry virus (24 hpi, MOI=0.01). n=4 biological independent experiments (i). ***P=2.25E-06. k, Jitter plots of VSV-M, VSV-N and VSV-P transcript levels. l, Immunostaining of hPSC-COs infected with SARS-CoV-2-entry virus (MOI=0.01). Scale bar= 50 μm. m, Schematic of the in vivo infection. n, Confocal image of colonic xenograft. Scale bar= 100 μm. Microscale bars= 30 μm. o, p, Confocal image of colonic xenograft 24 hpi (1X10³ FFU) stained with antibodies against luciferase (o) and ACE2 or Villin (p). Scale bar= 75 μm. Microscale bars= 25 μm. q, Immunostaining to detect SARS-CoV-2-nucleocapsid protein (SARS-N) in hPSC-COs. Scale bar= 100 μm. Microscale bars= 40 μm. r, RNA-seq read coverage of the viral genome in infected hPSC-COs (24 hpi, MOI=0.1). s-u, PCA plot (s), volcano plot (t), GSEA pathway analysis (u) of gene expression profiles from mock and SARS-CoV-2-infected hPSC-COs at 24 hpi (MOI=0.1). n=3 biological independent experiments. Red line indicates p=0.05. ***P < 0.001. Data were analyzed by an unpaired two-tailed Student’s t-test and shown as mean ± STDEV. Data are representative of at least three independent experiments.