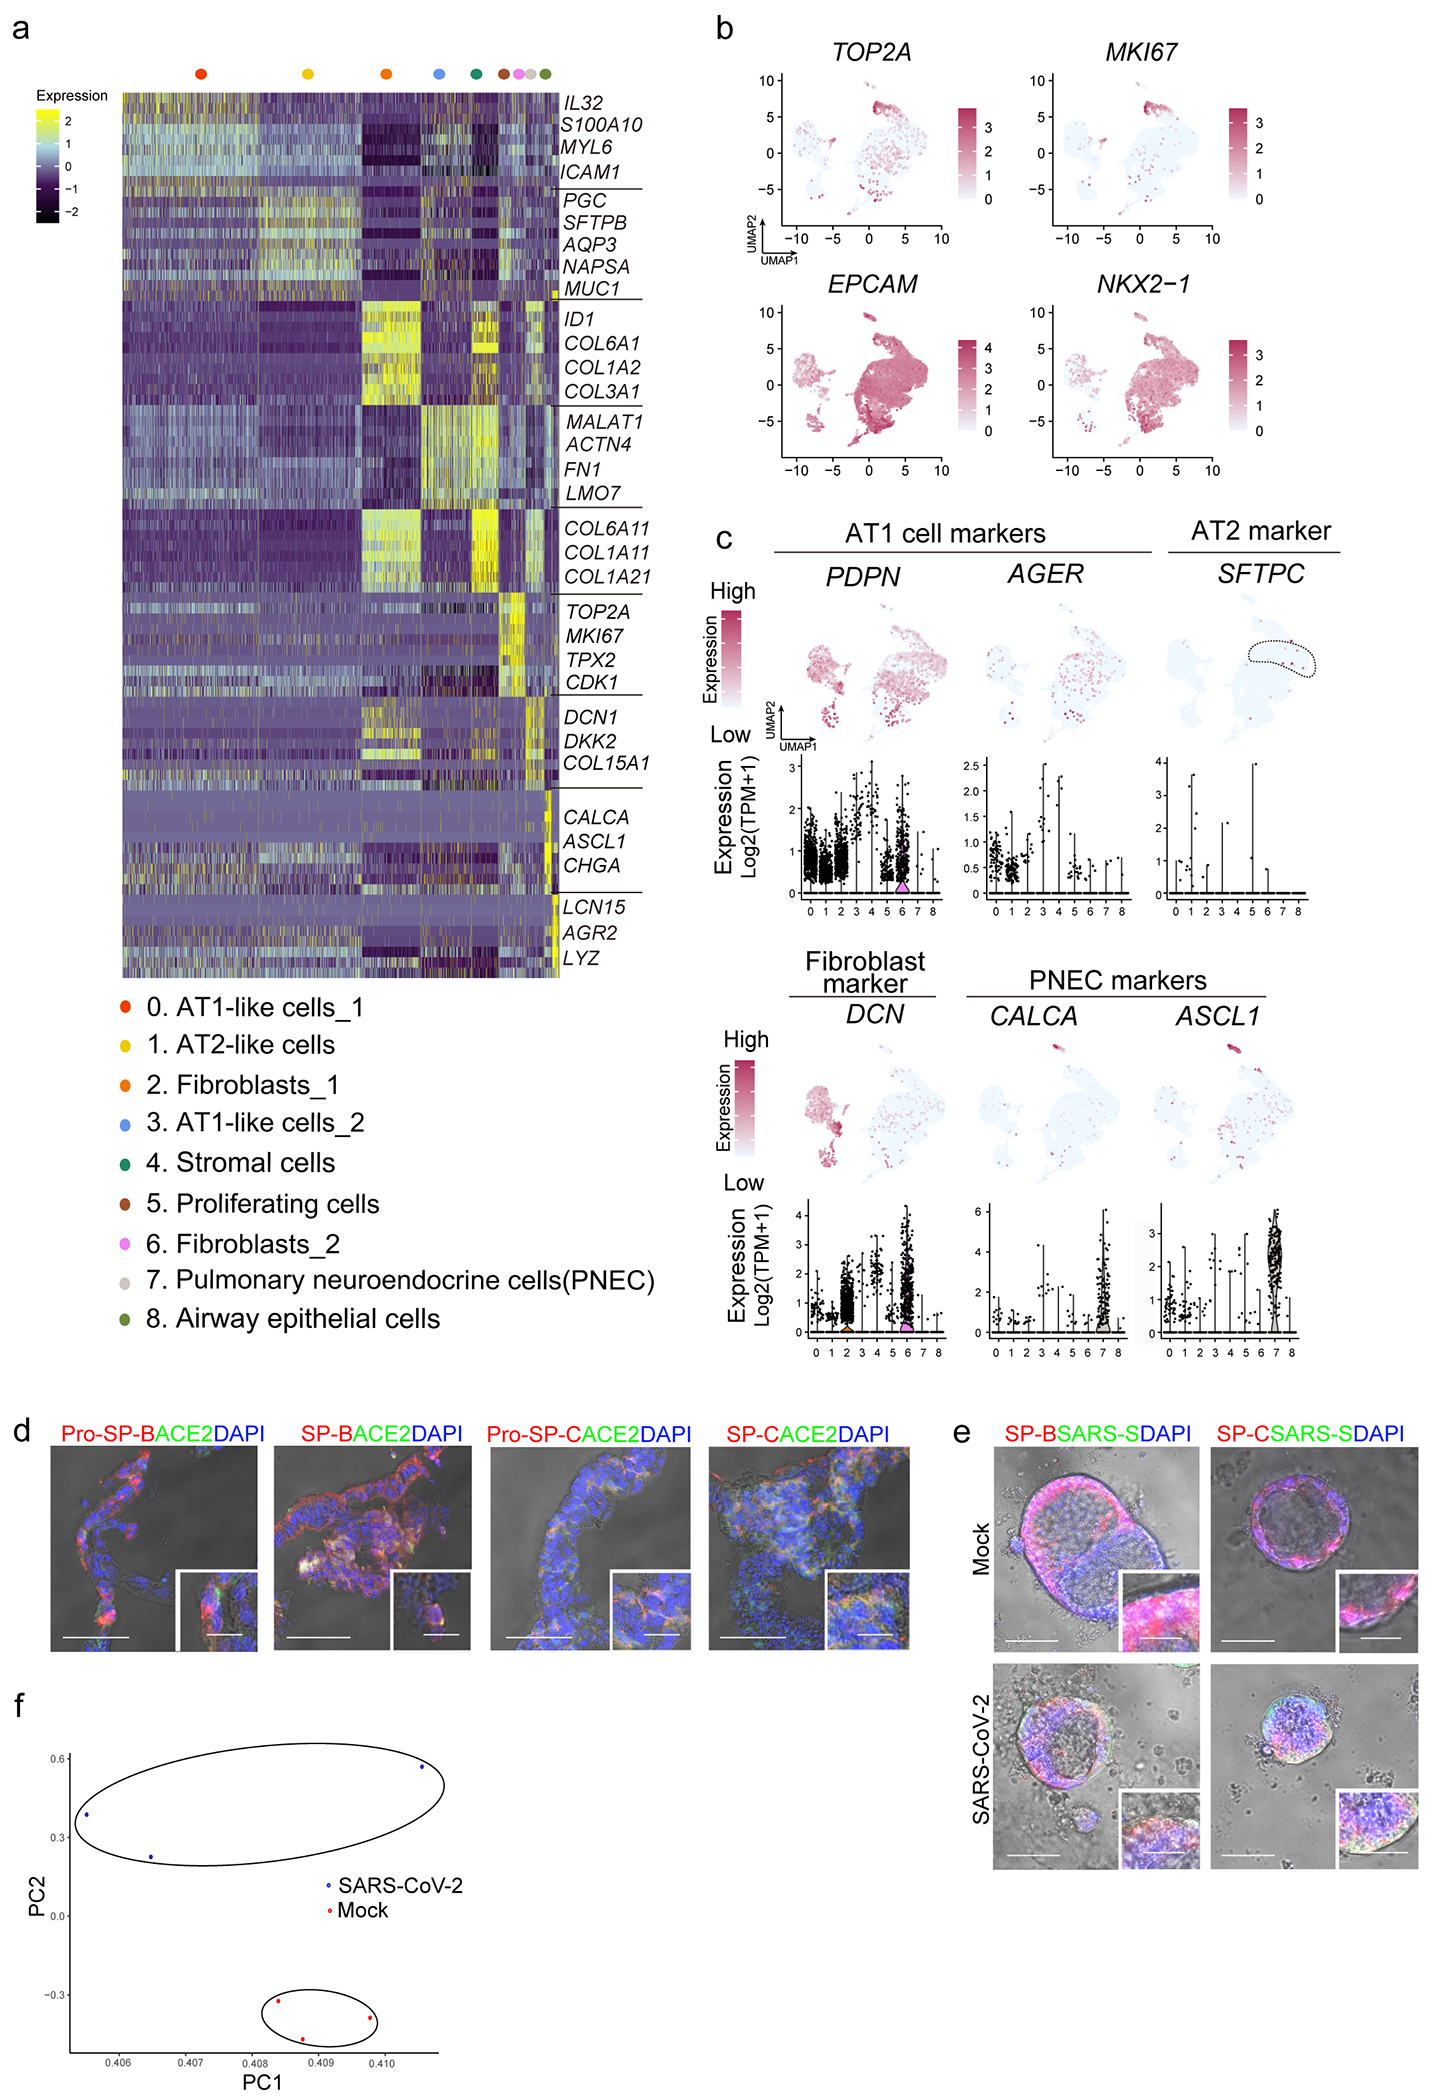
Extended Data Figure 2. Single cell RNA-seq of hPSC-LOs.

a, Heatmap of enriched genes in each cluster of scRNA profiles in hPSC-LOs. Each row represents one top differentially expressed gene and each column represents a single cell. b, UMAP of genes highly expressed in proliferating cells. c, Putative AT2, fibroblast and PNEC markers in each cluster in UMAPs. Relative expression level of each marker gene ranges from low (light blue) to high (pink) as indicated. Individual cells positive for lung cell markers are donated by red dots. The violin plot shows the expression level (log2(TPM+1)) of indicated gene in each cluster. d, Bright field+immunostaining images of cryo-section of hPSC-LOs. Scale bars= 30 μm. Microscale bars=10 μm. e, Bright field+immunostaining images of SARS-CoV-2 infected hPSC-LOs. Scale bars= 75 μm. Microscale bars= 25 μm. f, PCA plot of RNA-seq data from mock-infected or SARS-CoV-2 infected hPSC-LOs.
