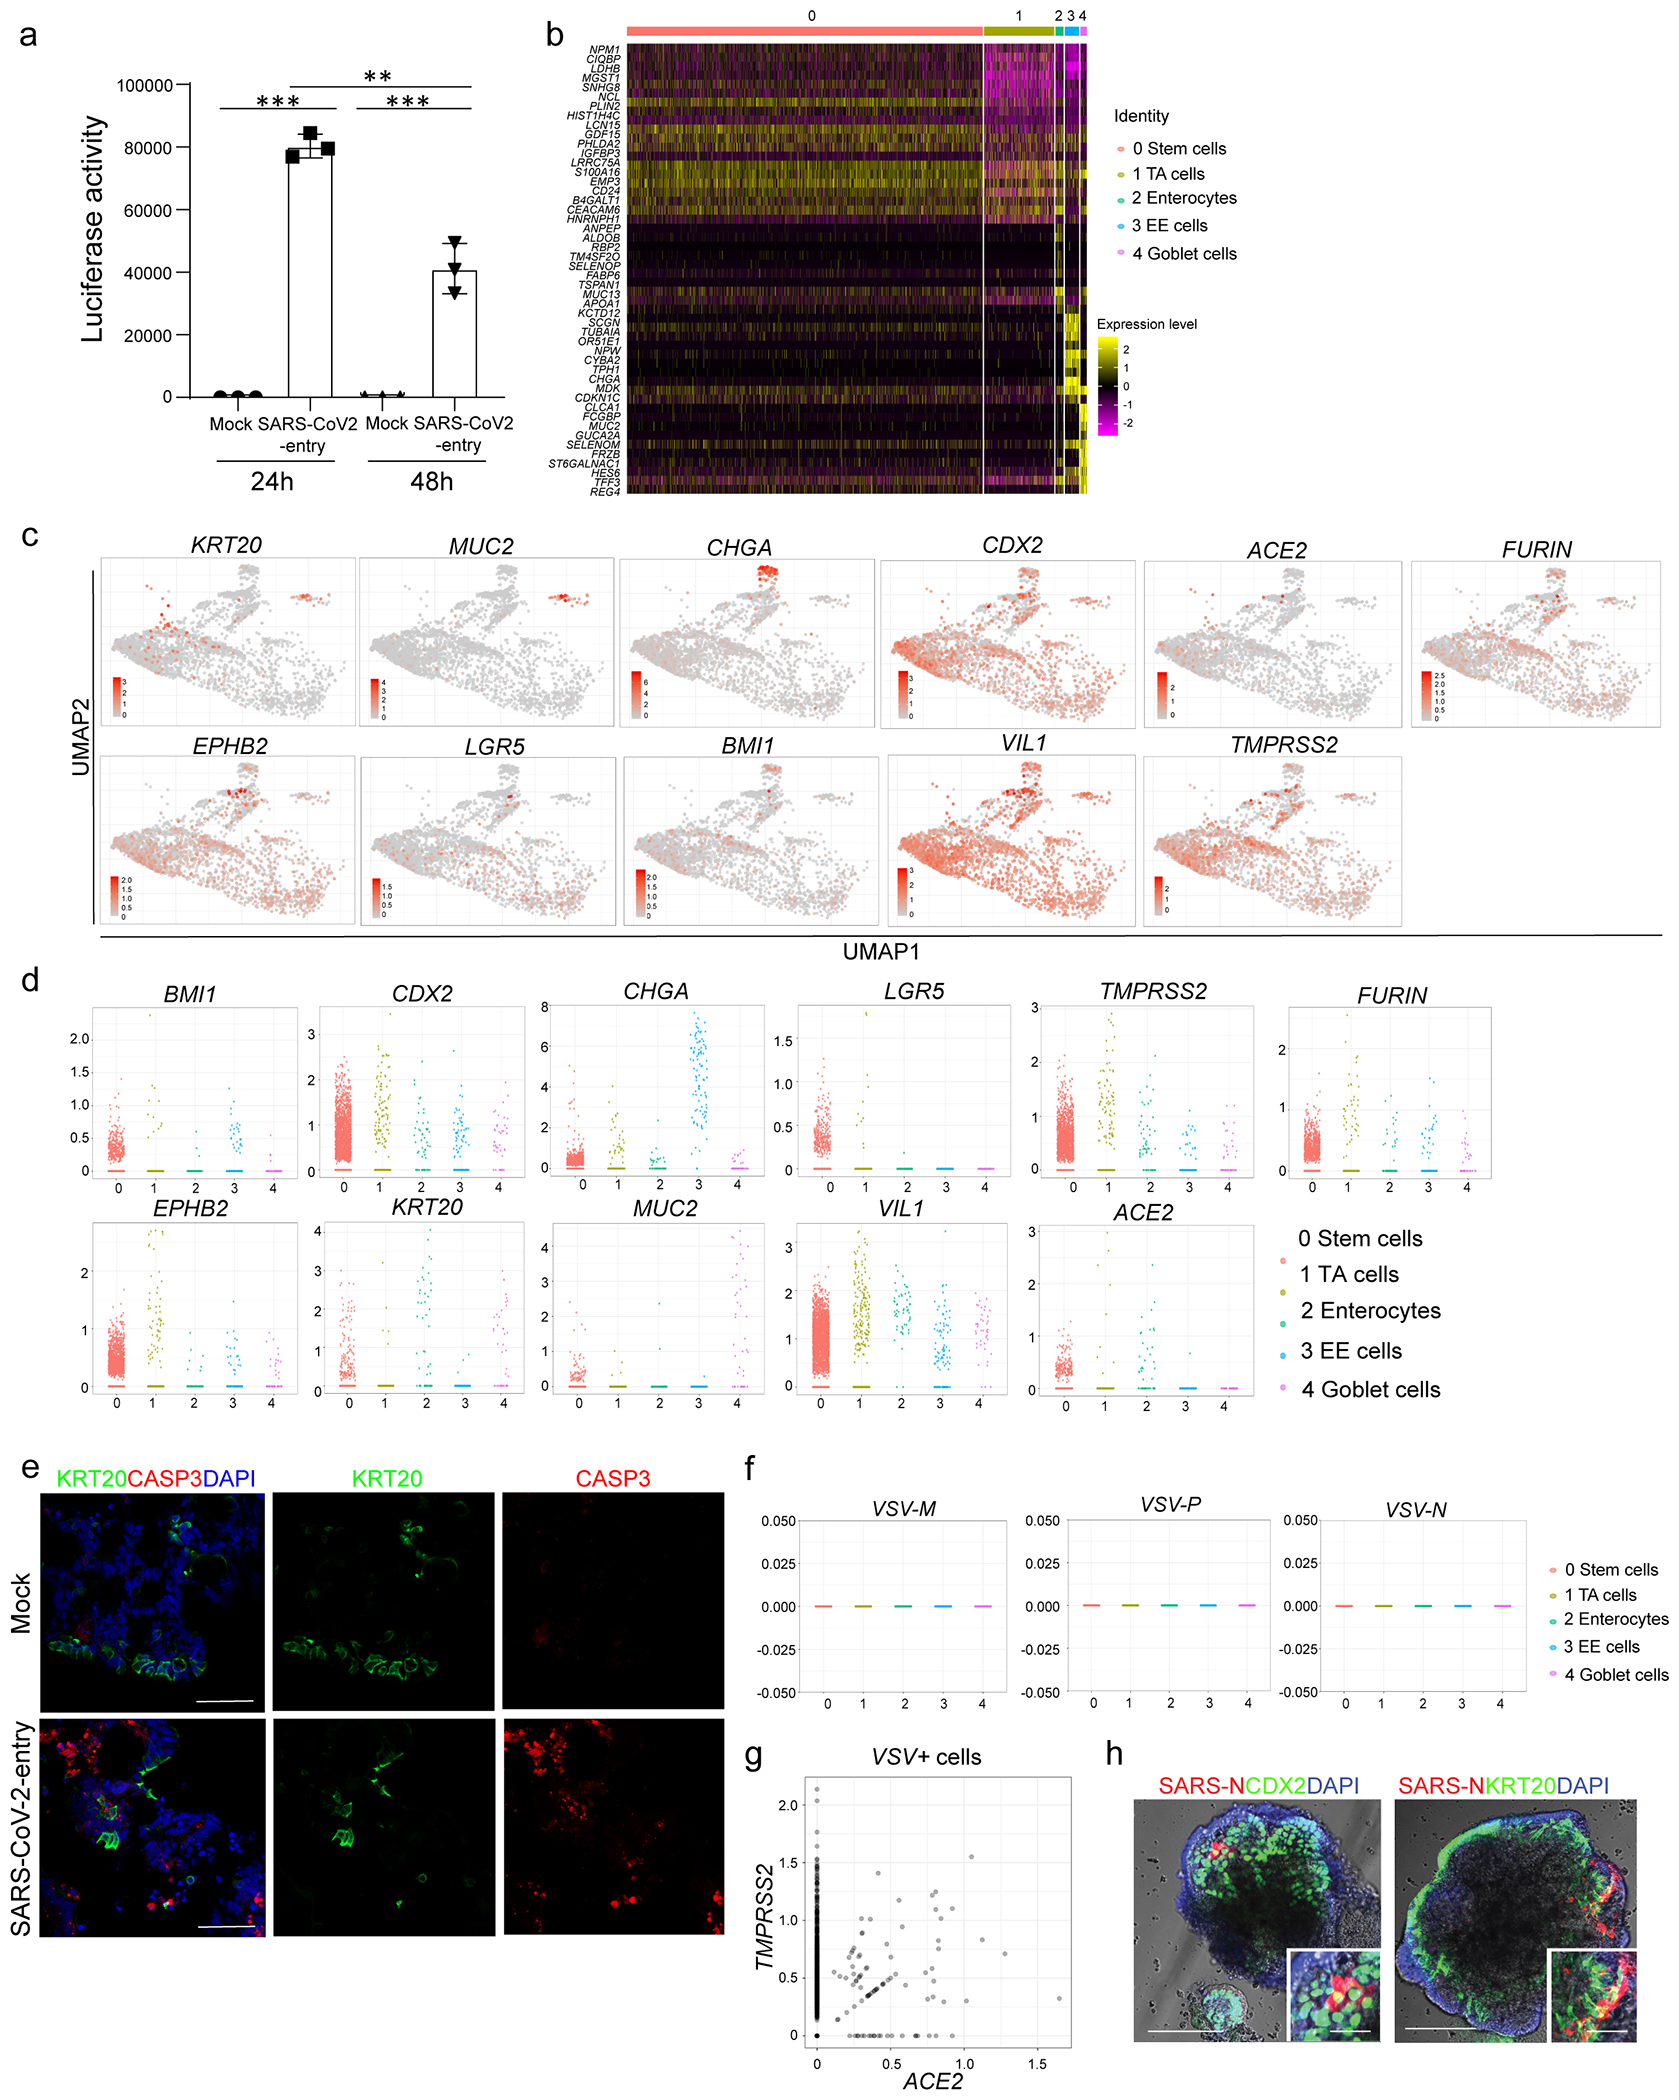
Extended Data Figure 5. Single cell RNA-seq analysis of hPSC-COs at 24 hpi with SARS-CoV-2-entry virus.

a, Relative luciferase levels in lysates derived from hPSC-COs inoculated with SARS-CoV-2-entry virus at 24 or 48 hpi (MOI=0.01). n=3 biological independent experiments. ***P=4.52E-08. Data were analyzed by ordinary one-way ANOVA and shown as Sidak’s multiple comparisons. b, Heatmap of top 10 differentially expressed genes in each cluster of single cell RNA-seq data. c, UMAP of ACE2, TMPRSS2, FURIN and colonic markers. d, Jitter plots for transcript levels of ACE2, TMPRSS2, FURIN and colonic markers. e, Representative immunostaining of infected hPSC-COs co-stained for KRT20 and CASP3. Scale bar= 50 μm. f, Jitter plots of transcript levels for VSV-M, VSV-N and VSV-P from hPSC-COs without SARS-COV-2 infection (mock). g, 2D correlation of expression levels for ACE2 and TMPRSS2 in VSV+ cells. h, Bright field+immunostaining images of SARS-CoV-2 infected hPSC-COs. Scale bars= 100 μm. Microcale bars= 40 μm. **P < 0.01, ***P< 0.001. Data are representative of at least three independent experiments.
