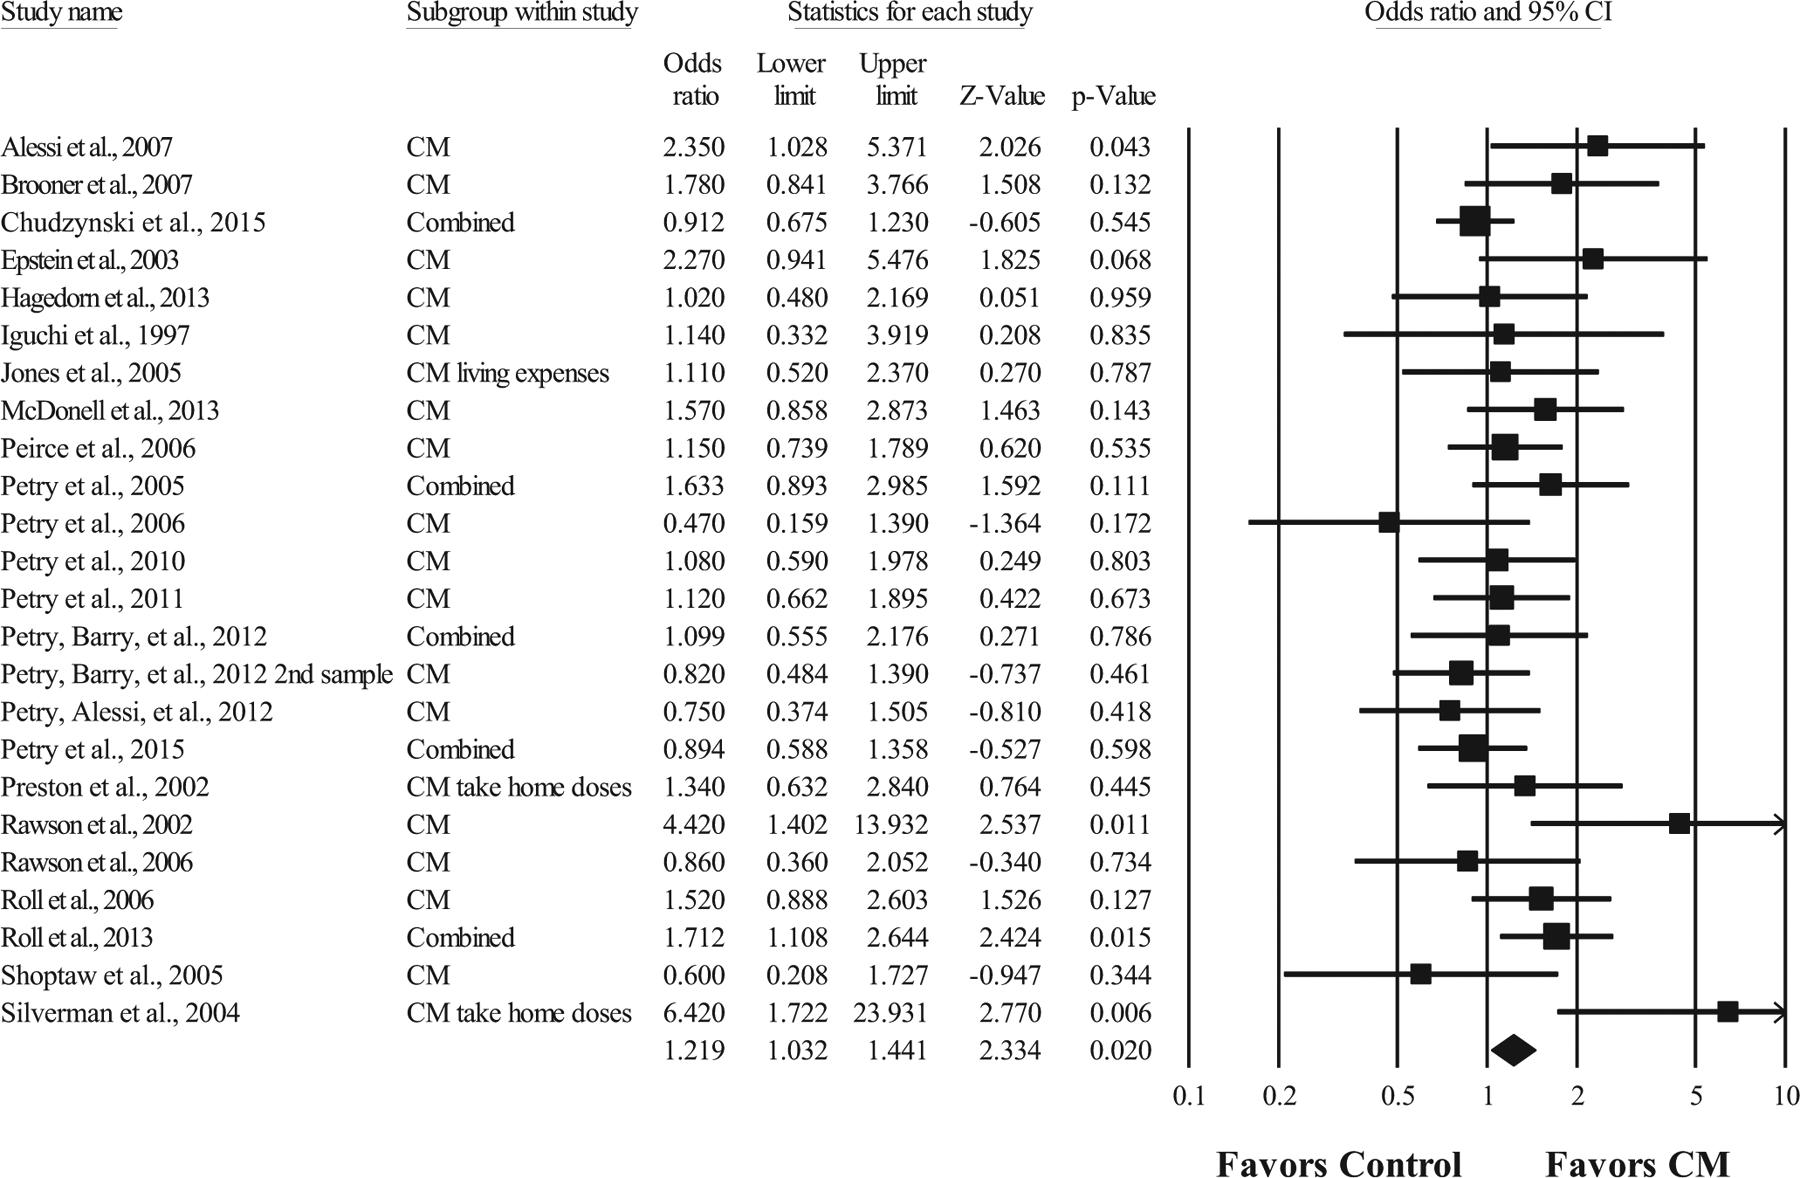
Figure 2. Forest Plot of Effect Sizes for Contingency Management Treatment Versus Comparison Conditions at Long-Term Follow-Up.

Note. Values are truncated after the third decimal point. The last row in the forest plot represents the overall odds ratio effect size of all studies. “Combined” indicates a study with multiple contingency management (CM) conditions that were summarized into one odds ratio effect size.
