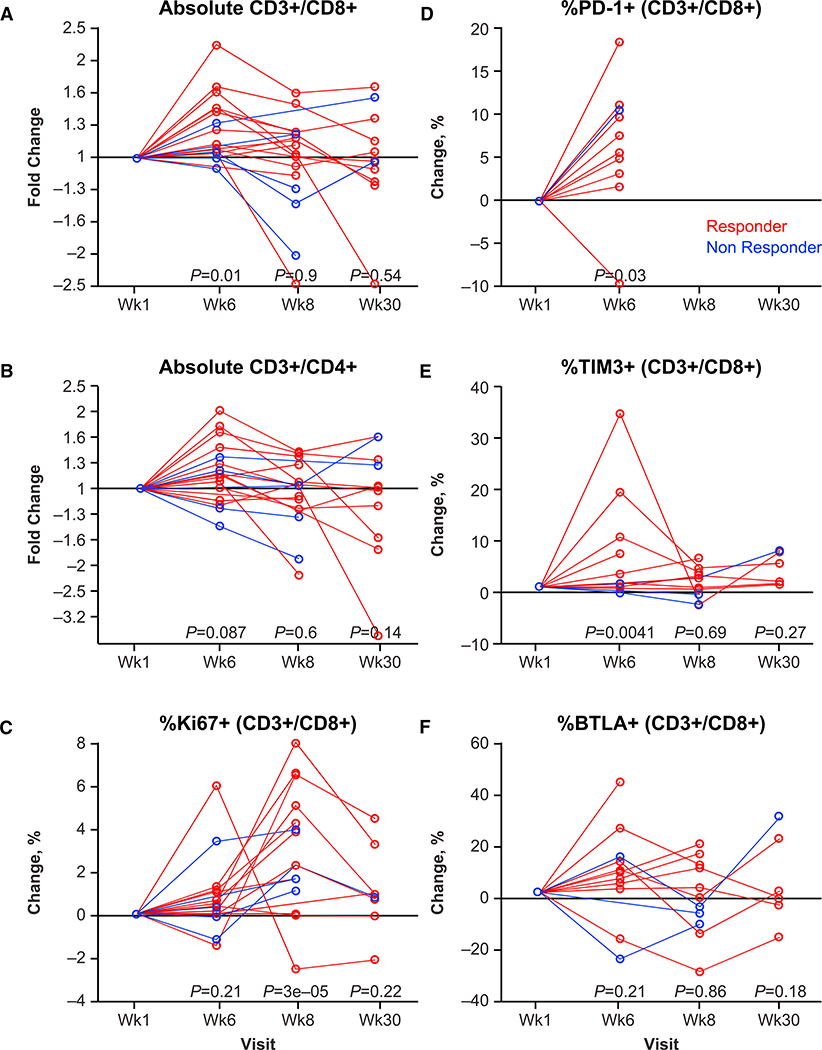
Figure 5. Circulating T Cell Subsets and Expression of Activation Markers.

Peripheral blood cells obtained from baseline, week 1, week 6, week 8, and week 30 were analyzed by flow cytometry.
(A) Fold change in absolute CD3+CD8+ cells.
(B) Fold change in absolute CD3+CD4+ cells.
(C) Percentage change in Ki67+ (CD3+CD8+) cells.
(D) Percentage change in PD-1+ (CD3+CD8+) cells at week 1 and week 6 only; after starting on pembrolizumab, the staining antibody competed for the same epitope.
(E) Percentage change in TIM3+ (CD3+CD8+) cells.
(F) Percentage change in BTLA+ (CD3+CD8+) cells.
p values for comparison with baseline are shown below data for each postbaseline visit, based on contrasts from linear mixed-effects modeling. Response is color-coded for best overall response per investigator (complete or partial response in red and nonresponse in blue). Abbreviations: BTLA, B- and T-lymphocyte attenuator; PD-1, programmed death protein 1.
