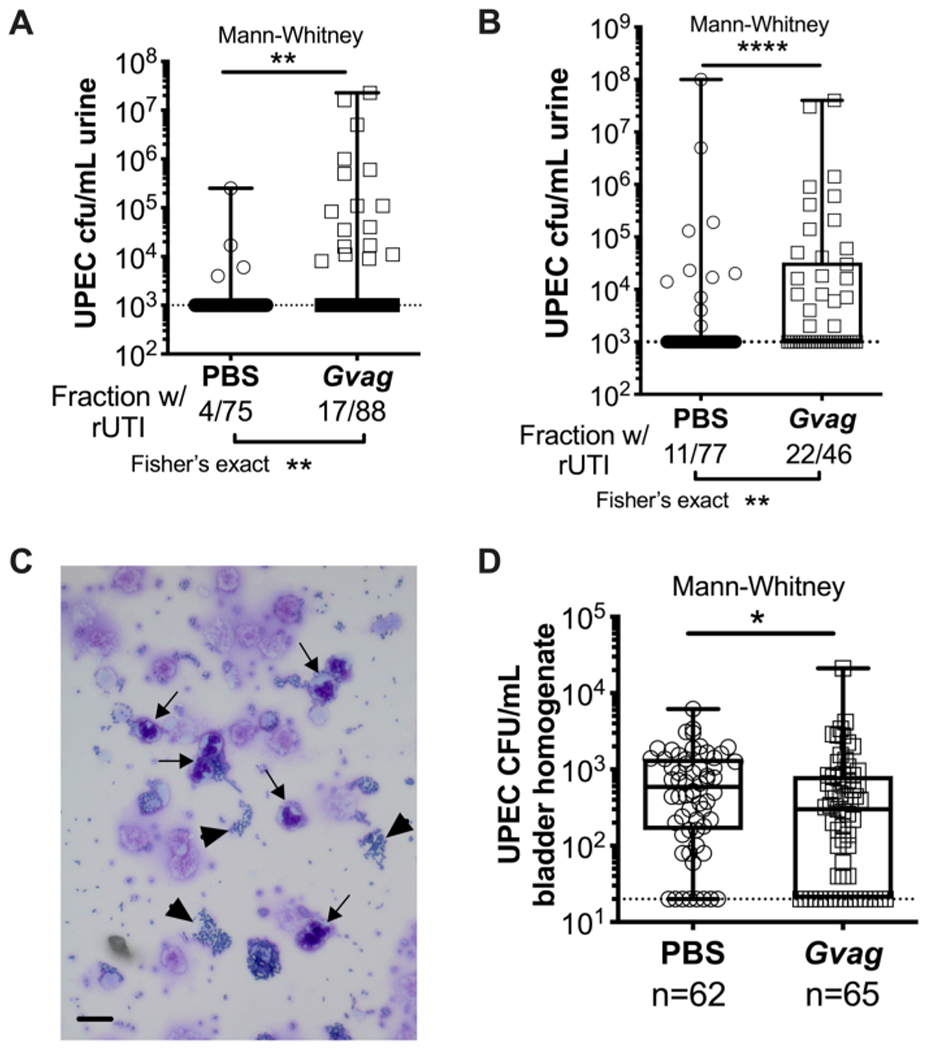
Figure 3. G. vaginalis triggers UPEC rUTI.

UPEC titers in urine following two sequential urinary tract exposures to PBS (circles) or G. vaginalis (Gvag; squares) given 12 h (A) or 1 wk (B) apart. Each symbol represents an individual mouse. The highest CFU/mL UPEC detected from each mouse between 1–3 d following the second exposure are plotted. Mice with no detectable bacteriuria are plotted at the limit of detection (dotted line). (C) Urine cytology analysis showing UPEC (arrowheads) and polymorphonuclear (PMN) cells (arrows). Scale bar = 20 μm. (D) UPEC titers in bladder tissues collected 3 d following two sequential urinary tract exposures given 1 wk apart. Each symbol represents a different mouse and zeros are plotted at the limit of detection (dotted line). In A, B, and D, boxes are at the first and third quartile with the median marked and whiskers from min to max. Mann-Whitney U tests * P < 0.05; ** P < 0.01; **** P < 0.0001.
