
Figure 4. SEM analysis of bladders fixed in situ.
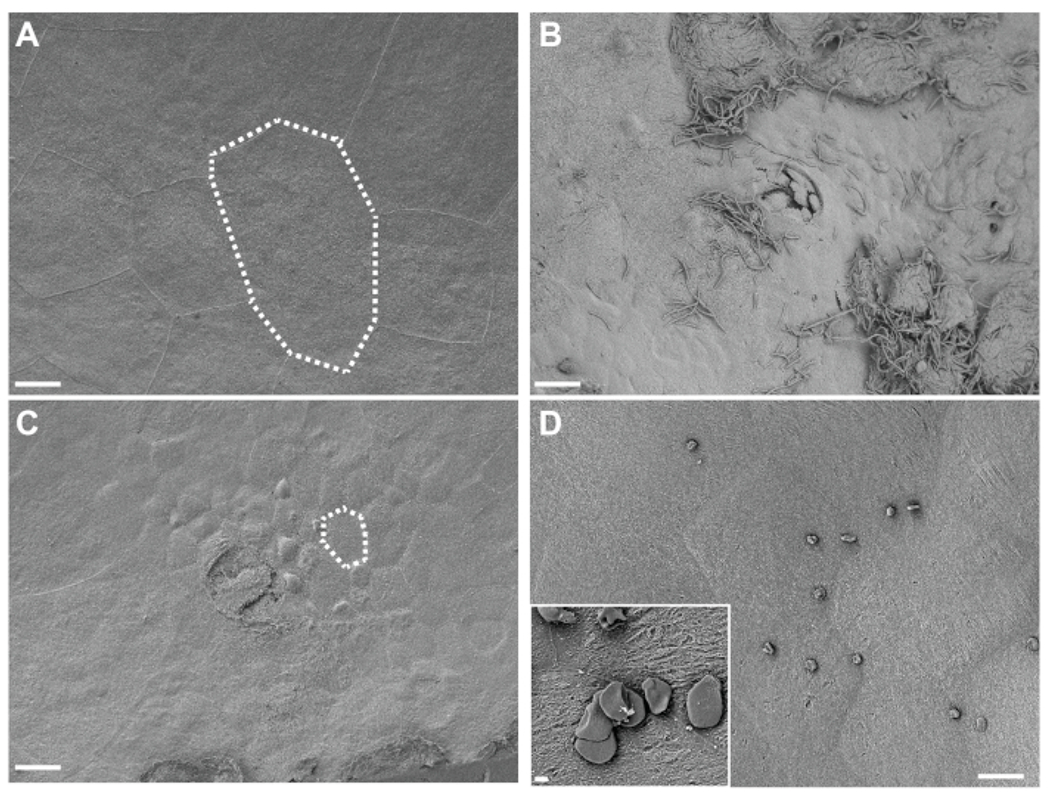
Bladders were collected from mice 3 h after two exposures (12 h apart) to PBS (A) or G. vaginalis (C). Dotted lines illustrate a single urinary epithelial cell, which is smaller in G. vaginalis-exposed bladders because the large superficial cells have exfoliated away revealing the underlying transitional epithelium. (B) Bladder collected 6 h after initial inoculation with UPEC, during Phase 1 of the model, showing urothelial exfoliation and extracellular UPEC. (D) Example of insoluble fat droplets present on the bladder surface. Scale bars are 20 μm in the main images and 2 μm in the inset.