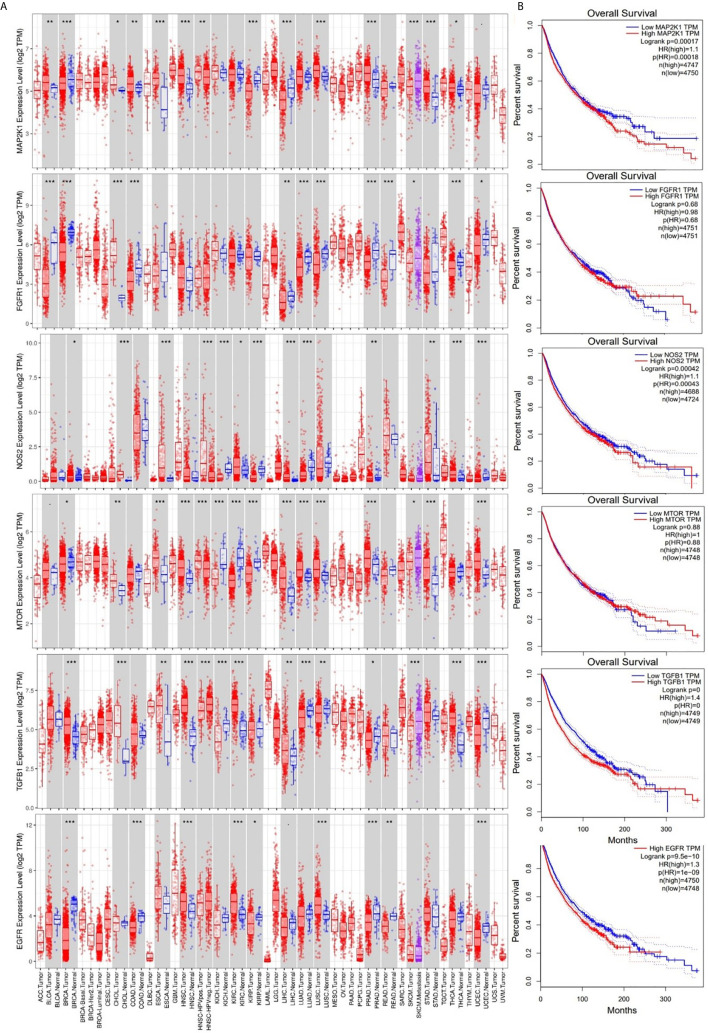
Figure 4.
Expression levels and prognostic values of epidermal growth factor receptor (EGFR), mammalian target of rapamycin (mTOR), nitric oxide synthase 2 (NOS2), transforming growth factor-β1 (TGFB1), mitogen-activated protein 2 kinase 1 (MAP2K1), and fibroblast growth factor receptor 1 (FGFR1) in The Cancer Genome Atlas (TCGA) cancer cohorts. (A) Box plots showing differential gene expression levels (log2 TPM) of signal transduction and activator of transcription 3 (STAT3)/cyclin-dependent kinase 2 (CDK2)/4/6 between tumor and adjacent normal tissue samples across TCGA database. Blue labels indicate normal tissues, and red labels indicate tumor samples. (B) Kaplan-Meier curve of overall survival of cancer cohorts with low and cohorts with high RNA expression levels of EGFR, mTOR, NOS2, TGFB1, MAP2K1, and FGFR1. Higher RNA expression profiles of MAP2K1/NOS2/EGFR were correlated with low overall survival of cohorts. The statistical significance of differentially expressed genes was evaluated using the Wilcoxon test. * p<0.05; ** p<0.01; *** p<0.001.

