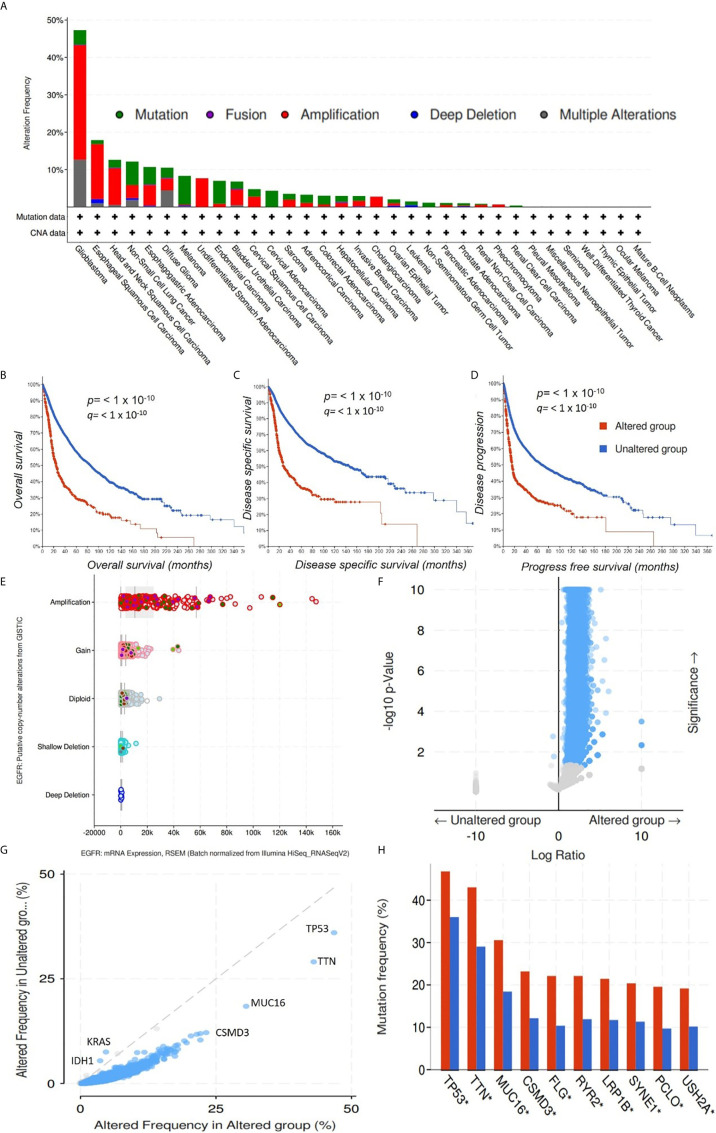
Figure 6.
Genomic alterations in the epidermal growth factor receptor (EGFR) are associated with poor prognoses of cancer cohorts. (A) Bar graph showing alteration frequencies of the EGFR in cohorts of different cancer types. The most common alteration in the EGFR gene was amplification. Kaplan-Meir survival curve of (B) overall survival, (C) disease-specific survival, and (D) disease-progression survival of cancer cohorts with altered EGFR and unaltered EGFR genes. Cohorts with altered EGFR had low overall survival, disease-specific survival, and disease-progression survival. p < 10−10. (E). Bar showing the EGFR putative copy number alterations and messenger RNA expressions. (F) Heat map showing p values and significance levels of other gene mutations associated with cohorts with altered EGFR and cohorts with unaltered EGFR. (G) Line graph showing frequencies of altered genes in cancer cohorts with altered EGFR and cohorts with unaltered EGFR. (H) Bar graph showing gene mutations that were significantly enriched in both EGFR-altered and EGFR-unaltered cohorts.

