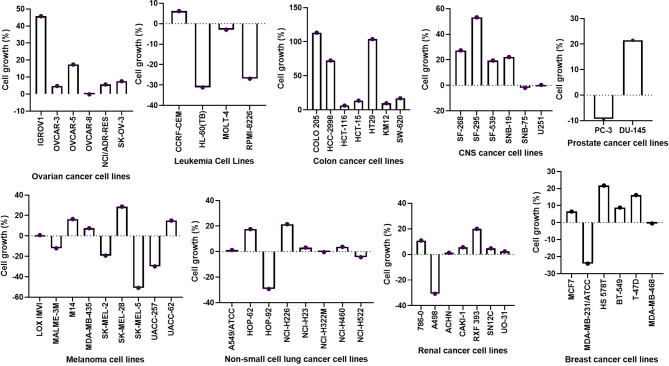
Figure 9.
Inhibitory activities of NSC765598 against panels of 60 human cancer cell lines. Each cell line was treated with a single dose of 10 μM of NSC765598 for 48 h. The bar points above point zero on the y-axis indicate the mean percentage of cell growth relative to cells without drug treatment, while bar points below point zero indicate the percentage of cell death.

