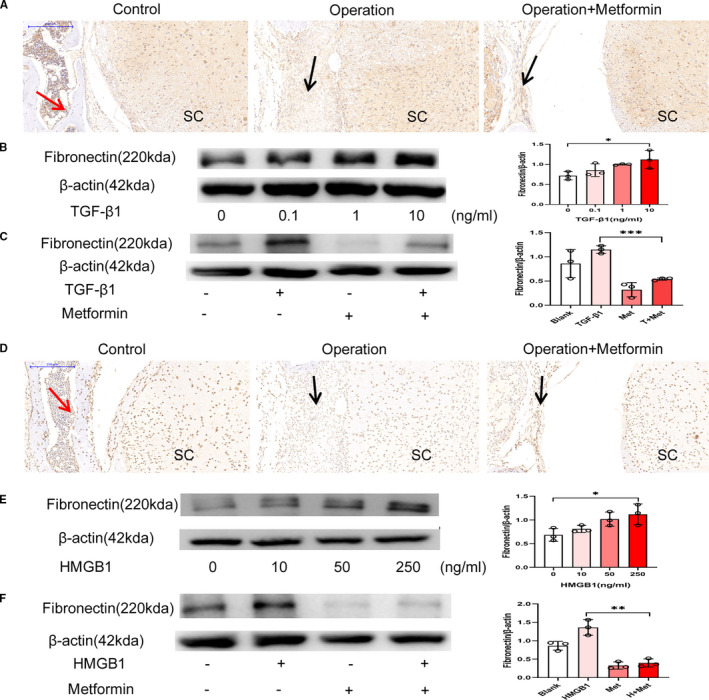
FIGURE 3.

Metformin reduced TGF‐β1 and HMGB1 levels. (A) Immunohistochemical staining images of TGF‐β1 after laminectomy; the red arrow indicates the lamina, the black arrow indicates the epidural scar, and ‘SC’ indicates the spinal cord. The TGF‐β1 content in the metformin group was significantly lower than that in the operation group. (B) Western blot showing the expression of fibronectin in NIH‐3T3 cells treated with TGF‐β1 at different concentrations for 48 hours; treatment with 10 ng/mL TGF‐β1 clearly induced fibronectin expression. *, P < .05. (C) Metformin mitigated the effects of TGF‐β1 on the expression of fibronectin in NIH‐3T3 cells. ***, P < .001. (D) Immunohistochemical staining images of HMGB1 after laminectomy; the red arrow indicates the lamina, the black arrow indicates the epidural scar and ‘SC’ indicates the spinal cord. Metformin treatment reduced the number of HMGB1‐positive cells. (E) Western blot showing the expression of fibronectin in NIH‐3T3 cells treated with HMGB1 at different concentrations for 48 hours; treatment with 250 ng/mL HMGB1 promoted the expression of fibronectin. *, P < .05. (F) Metformin mitigated the effects of HMGB1 on the expression of fibronectin in NIH‐3T3 cells. **, P < .01
