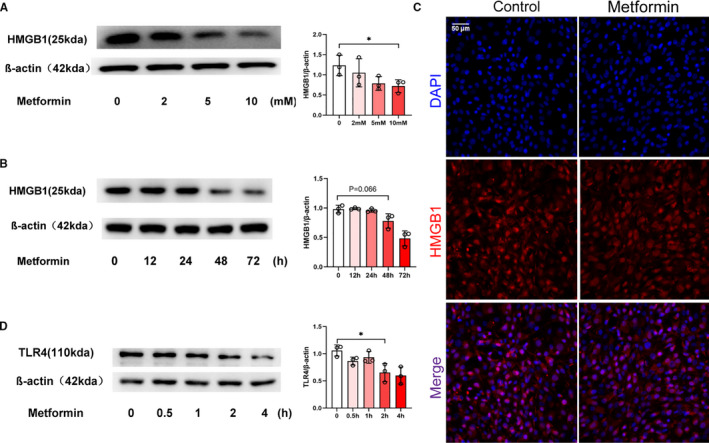
FIGURE 5.

Metformin reduced HMGB1/TLR4 signalling. (A) Western blot showing the expression of HMGB1 in NIH‐3T3 cells treated with metformin at different concentrations. Treatment with 10 mmol/L metformin significantly down‐regulated HMGB1. *, P < .05. (B) Western blot showing the expression of HMGB1 at different time‐points in NIH‐3T3 cells treated with metformin. The analysis showed a significant decreased expression of HMGB1 at 48th hour. P = .066. (C) NIH‐3T3 cells cultured in metformin for 48th hour and stained with DAPI (pseudo‐blue) and an anti‐HMGB1 antibody (red) followed by laser confocal microscopy. The expression of HMGB1 in NIH‐3T3 cells was reduced after metformin treatment. (D) Western blot showing the expression of TLR4 at different time‐points in NIH‐3T3 cells treated with metformin. The expression of TLR4 began to decrease significantly after metformin treatment for 2 hours. *, P < .05
