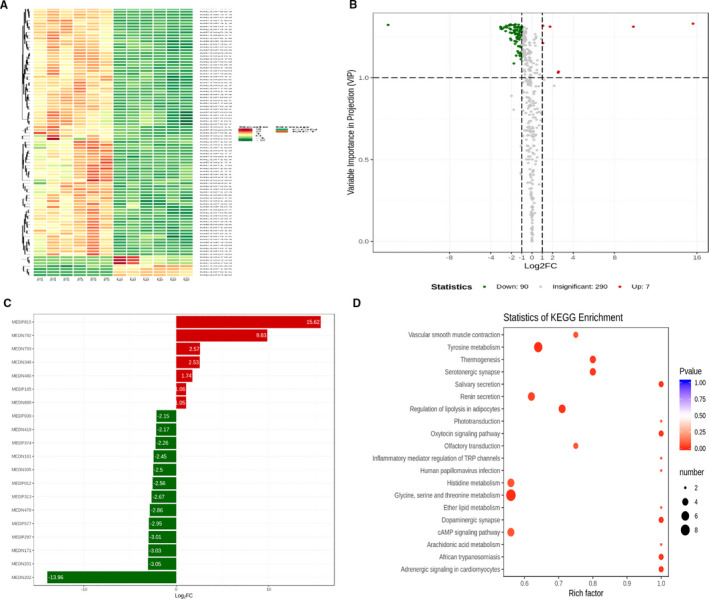
FIGURE 7.

Metformin influenced metabolomics in fibroblast cells. (A) Heatmap presenting the distribution of differential metabolites between metformin‐treated and un‐treated NIH‐3T3 cells. (B) Volcano plots presenting the different levels and statistical significance of metabolites in the supernatants obtained from both groups. (C) Top twenty differential metabolites by the fold‐change value transformed by log2 group between the groups. (D) Overview of the pathway analysis based on the selected supernatant metabolites from the metformin‐treated NIH‐3T3 cells
