
FIGURE 8.
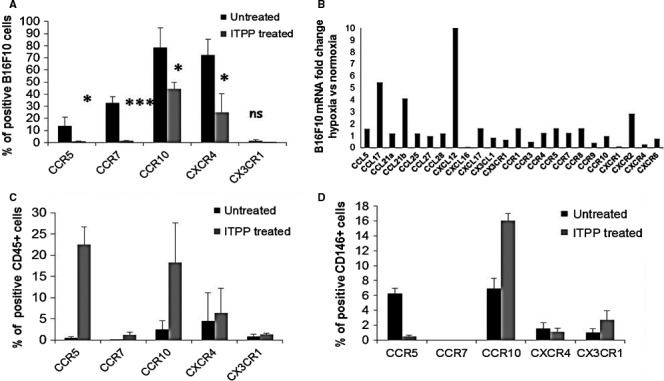
Chemokine receptor modulation of expression on tumour cells and immune and endothelial enriched cell populations by ITPP treatment–induced vessel normalization. A, Flow cytometry detection of the expression of chemokine receptors on B16F10 cells in the tumour site. B, RT‐qPCR quantification of the mRNA relative expression of chemokines and receptors by B16F10 cells in hypoxia as compared to normoxia. Data represent the mean values from five experimental mice of one representative experiment out of five. C, Flow cytometry detection of the expression of chemokine receptors on CD45+ immune cells in the tumour site. D, Flow cytometry detection of the expression of chemokine receptors on the endothelial enriched cell population in the tumour site. Data represent the means of five experimental mice from three separate experiments (*P < .05, **P < .01, ***P < .0005)