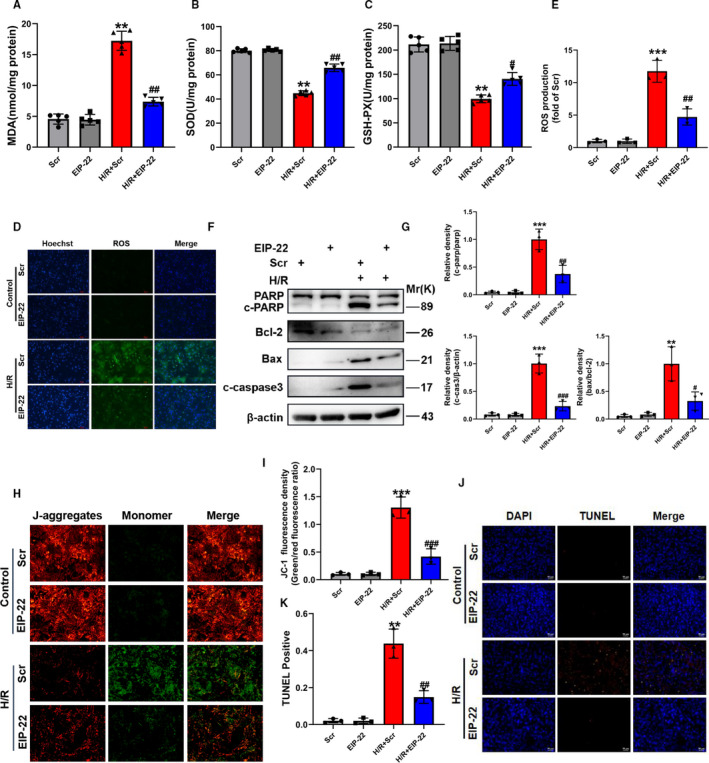
FIGURE 2.

EIP‐22 attenuates oxidative stress and apoptosis in H/R model. A, Cellular MDA content in H/R model. B, Cellular SOD activities in H/R model. C, Cellular GSH‐Px activities in H/R model. D, Representative images of ROS staining in H/R model. DCFH‐DA was used to detect intracellular ROS. Green, ROS. Blue, Hoechst. E, Quantification analysis of ROS. F, The proteins related to apoptosis (PARP, cleaved caspase‐3, Bax, Bcl‐2) were measured by Western blot in H/R model. G, Quantitative analysis of relative protein expression of PARP, cleaved‐caspase, Bax and Bcl‐2. H, Representative images of mitochondrial membrane potential in H/R model. I, Quantification analysis of JC‐1 fluorescence intensity. J, Representative images of TUNEL staining in H/R model. K, Quantification analysis of TUNEL. The data represent means ± SD. ** P < .01 vs. the Scr group, *** P < .001 vs. the Scr group, # P < .05 vs. the H/R + Scr group, ## P < .01 vs. the H/R + Scr group, ### P < .001 vs. the H/R + Scr group
