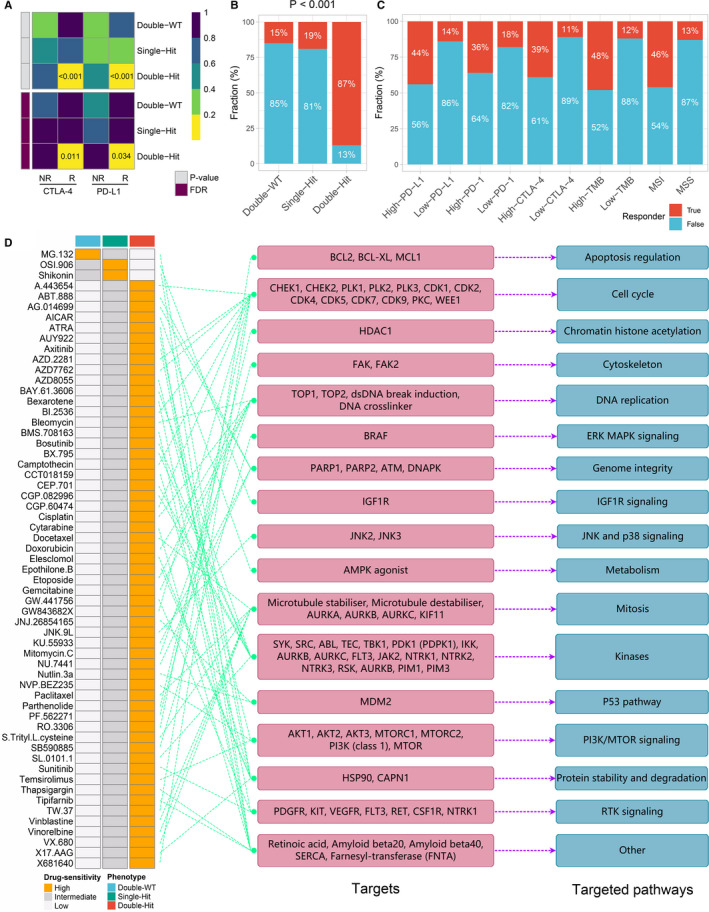
FIGURE 6.

Assessment of immunotherapy and chemotherapy among three phenotypes. A, SubMap algorithm evaluated the expression similarity between the three phenotypes and the patients with different immunotherapy responses. B, Distribution of immunotherapy responders predicted by TIDE algorithm in three phenotypes. C, Distribution of immunotherapy responders in different groups. D, A total of 59 potential antitumour drugs with specific sensitivity to each phenotype were identified. The left panel is the drug names and the level of sensitivity in each phenotype, the middle panel is the drug‐targeted molecules, whereas the right panel represents the drug‐targeted pathways
