
FIGURE 2.
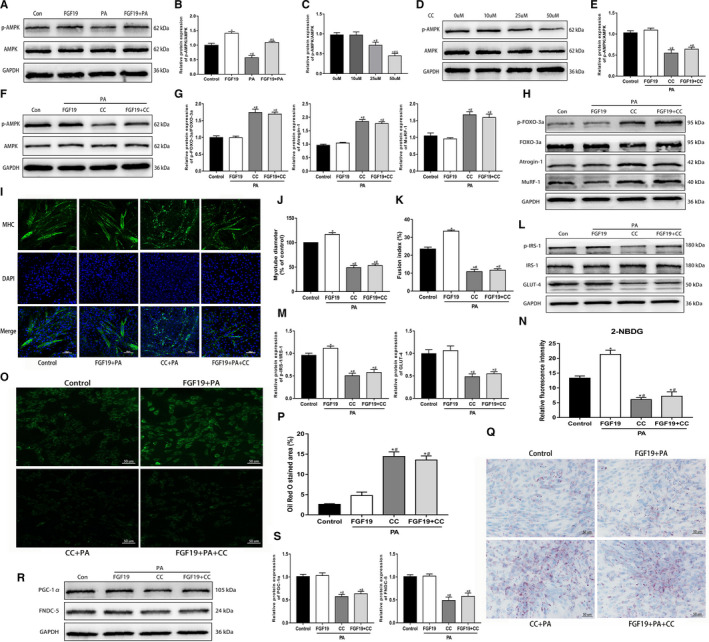
FGF19 attenuated PA‐induced muscle atrophy, glucose and lipid metabolic derangement and reduced FNDC‐5/irisin expression via the AMPK pathway. A, B, Western blot analysis of p‐AMPK/AMPK protein expression in cells treated with FGF19 in the presence or absence of PA. C, D, The effect of different concentrations (0, 10, 25, 50 µM) of the AMPK inhibitor CC on p‐AMPK/AMPK protein expression. E, F, Western blot analysis of p‐AMPK/AMPK protein expression in the control (Con), FGF19 + PA, CC + PA and FGF19 + PA + CC groups. (G‐H) Protein expression of muscle atrophy markers (p‐FOXO‐3a/FOXO‐3a, Atrogin‐1, MuRF‐1) were measured by western blotting. I‐K, Representative images of MHC immunofluorescence (scale bar = 100 μm) in C2C12 myotubes, the diameter of myotubes and the fusion index. L, M, The expression of glucose uptake‐related proteins (p‐IRS/IRS‐1, GLUT‐4) was identified by western blotting. N, O, Representative images of glucose uptake tested by 2‐NBDG (scale bar = 50 μm). P, Q, Representative images of lipid droplet infiltration stained with Oil Red O (scale bar = 50 μm). R, S, Western blot analysis of the expression of irisin production‐related proteins (PGC‐1α, FNDC‐5). All data are presented as the mean ± SEM. *P < 0.05 compared with the control group, # P < 0.05 compared with the FGF19, 10 µM CC or FGF19 + PA group, & P < 0.05 compared with the PA or 25 µM CC group