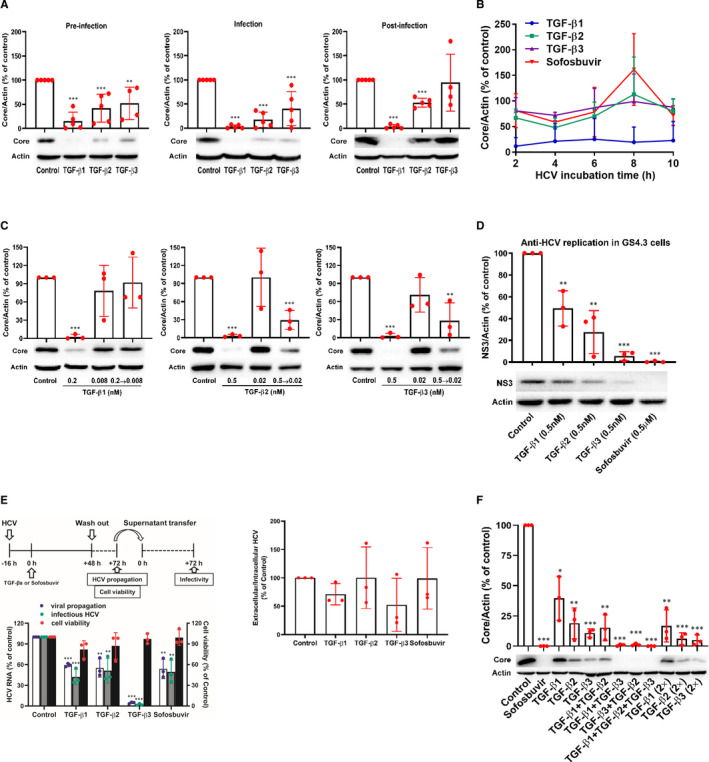
FIGURE 2.

TGF‐β isoforms inhibit HCV at distinct stages in the HCV life cycle and have additional anti‐HCV effects combined with each other. A, Huh7.5 cells were pre‐treated with TGF‐β isoforms (0.5 nmol/L) for 2 h followed by HCV infection for 2 h (pre‐infection), simultaneously treated with TGF‐β isoforms (0.5 nmol/L) and HCV for 2 h (infection), or infected with HCV for 2 h followed by TGF‐β isoforms (0.5 nmol/L) 2 h treatment (post‐infection). Intracellular proteins were measured by WB analysis at 72 h. B, Huh7.5 cells were treated with TGF‐β isoforms (0.5 nmol/L) or sofosbuvir (0.5 μmol/L) for 2 h after 2, 4, 6, 8 and 10 h of HCV infection, intracellular proteins were quantified by WB at 72 h. C, HCV viral stock was pre‐treated with 0.2 nmol/L TGF‐β1, 0.5 nmol/L TGF‐β2 or 0.5 nmol/L TGF‐β3 at 37°C for 2 h and then used to infect Huh7.5 cells after 25‐fold dilution (the concentration of TGF‐β1 from 0.2 to 0.008 nmol/L, or TGF‐β2 or TGF‐β3 from 0.5 to 0.02 nmol/L). Infection with untreated HCV stock was performed in parallel in the presence of TGF‐β isoforms at indicated concentrations. Intracellular HCV core was determined by WB. D, GS4.3 cells were treated with TGF‐β isoforms or sofosbuvir for 72 h, and intracellular proteins were extracted and detected with WB. E, Schematic of the experiment (left, up). Huh7.5 cells were incubated with HCV viral stock for 16 h, and then treated with TGF‐β isoforms (0.5 nmol/L) or sofosbuvir (0.5 μmol/L) for 48 h followed by replacing the culture medium. After 24 h, the cell viability was tested using MTT assay, the culture medium was collected, and intracellular RNA was quantified by qRT‐PCR. Meanwhile, naïve Huh7.5 cells were incubated with above culture supernatants for 72 h and the intracellular RNA was quantified by qRT‐PCR (left, down). The ration of extracellular infective HCV particle and intracellular HCV level was calculated (right). F, Huh7.5 cells were inoculated with HCV viral stock and simultaneously treated with 0.04 nmol/L TGF‐β1, 0.05 nmol/L TGF‐β2, 0.1 nmol/L TGF‐β3 alone, in combination, double concentration (2×) or sofosbuvir (0.5 μmol/L). At 72 h, intracellular proteins were detected by WB analysis. *P < 0.05, **P < 0.01, ***P < 0.001 vs solvent control. Data represent the mean ± SD from more than three independent experiments. ANOVA analysis followed by the Student's t test method was used
