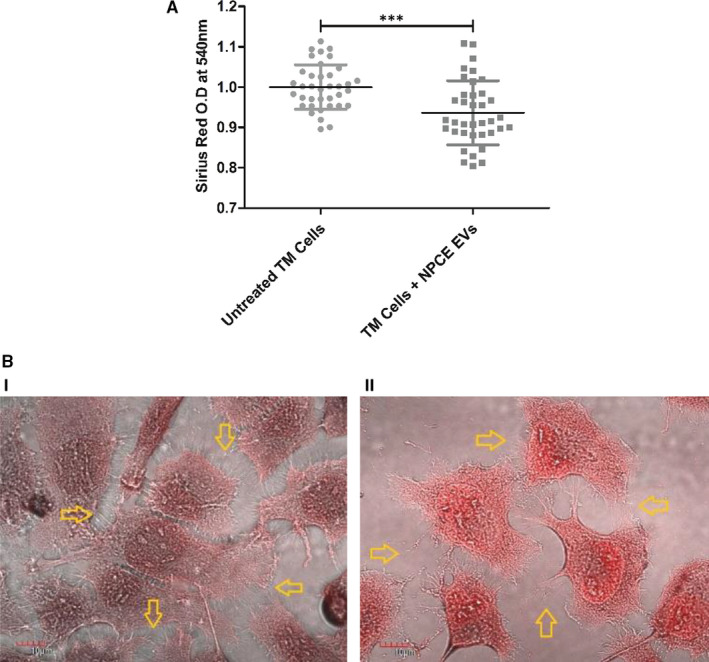
FIGURE 2.

Staining of collagen with Sirius Red reagent. The staining intensities of collagen derived from untreated or treated TM cells with NPCE EVs were determined by ELISA reader at 540 nm. A, The bar graph represents the means ± SD from three independent experiments performed in triplicates. B, Representative confocal images of stained collagen from both untreated (i) or treated (ii) TM cells with NPCE EVs, scale bars are of 10 µm. A minimum of 30 images per treatment was collected. Yellow arrows point to collagen fibrils in the ECM of TM cells. Data represent means ± SD from three independent experiments performed in triplicates. Student's t test was used to determine a statistical difference, as indicated by asterisks (***P < .001)
