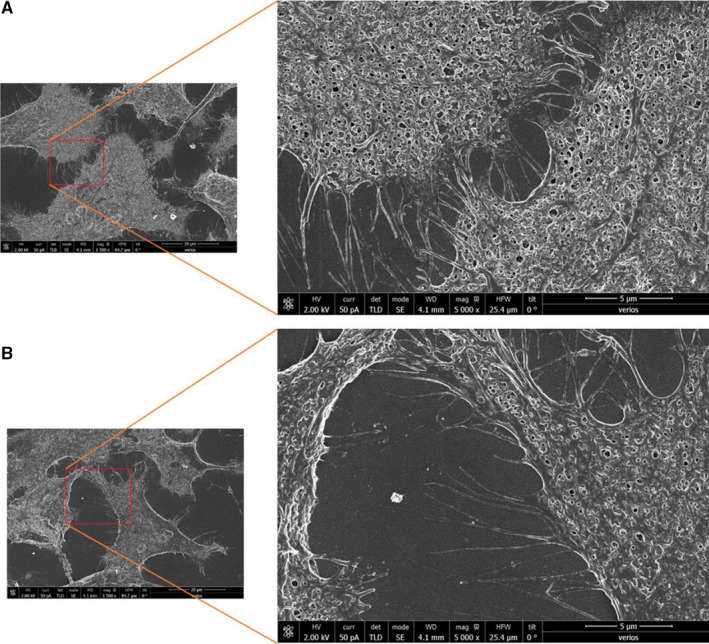
FIGURE 3.

Representative SEM images illustrating the presence or absence of Collagen fibres in the ECM of TM cells. A comparison was made between ECM Collagen fibres of untreated (A) or treated TM cells with NPCE EVs (B). The SEM images magnification are 1500× with the inserts 5000×, scale bars are of 5 µm. A minimum of 30 images per treatment was collected
