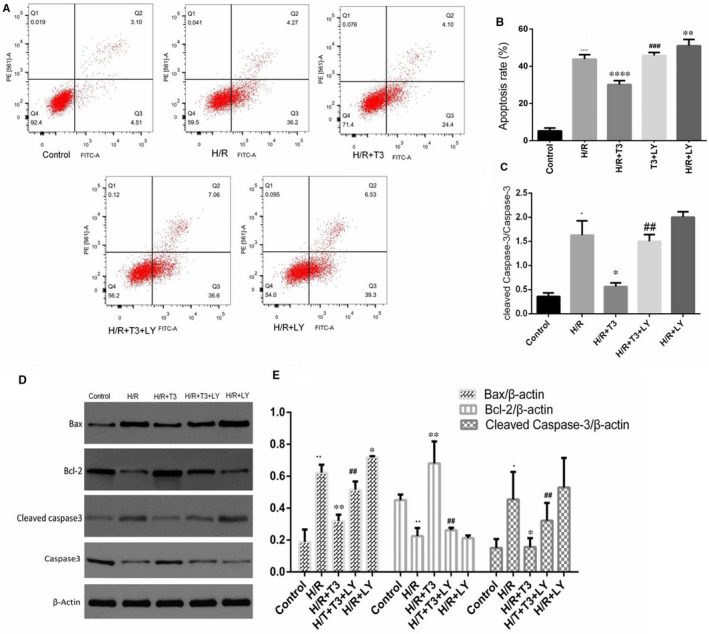
FIGURE 3.

T3 protected cardiomyocytes from H/R‐induced apoptosis. A, Apoptosis in cardiomyocytes was analysed by flow cytometry and (B) Quantitative analysis of the percentages of apoptotic cells in each group. C, Data acquired from Western blotting showed the ratio of cleaved capase‐3/caspase‐3 in each group. D, The expression of Bax, Bcl‐2 and cleaved caspase‐3 was analysed by Western blotting and E, Representative bands quantified in the corresponding bar graph. β‐actin protein expression was used for normalization. The values were expressed as the mean ± SD in the experiment. n = 6. ·P <.05 vs control, ··P <.01 vs control, ····P <.0001 vs control; * P <.05 vs H/R, ** P <.01 vs H/R, **** P <.0001 vs H/R; ## P <.01 vs H/R + T3, ### P <.001 vs H/R + T3
