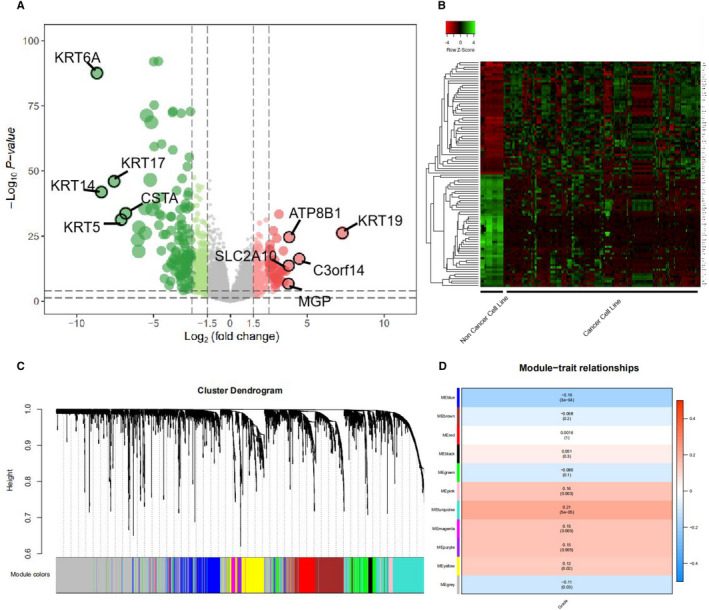
FIGURE 1.

(A) Volcano plot of differentially expressed genes (DEGs) between human breast cancer cell lines and normal breast cells. Red represents genes that are highly expressed in tumour cell lines compared to normal human breast cells, and green represents genes that are lower expressed compared to normal breast cells. (B) Compared with normal human breast cell lines, heat map analysis of the top 50 differentially expressed genes with high and low expression. (C,D) WGCNA analysis of microarray data from 361 clinical BC tissues from the MERAV database. (C) Dendrogram of genes clustered based on a dissimilarity measure (1‐TOM). The colour band shows the results from the automatic single block analysis. (D) Heat map of the correlation between module eigengenes and clinical traits of BC
