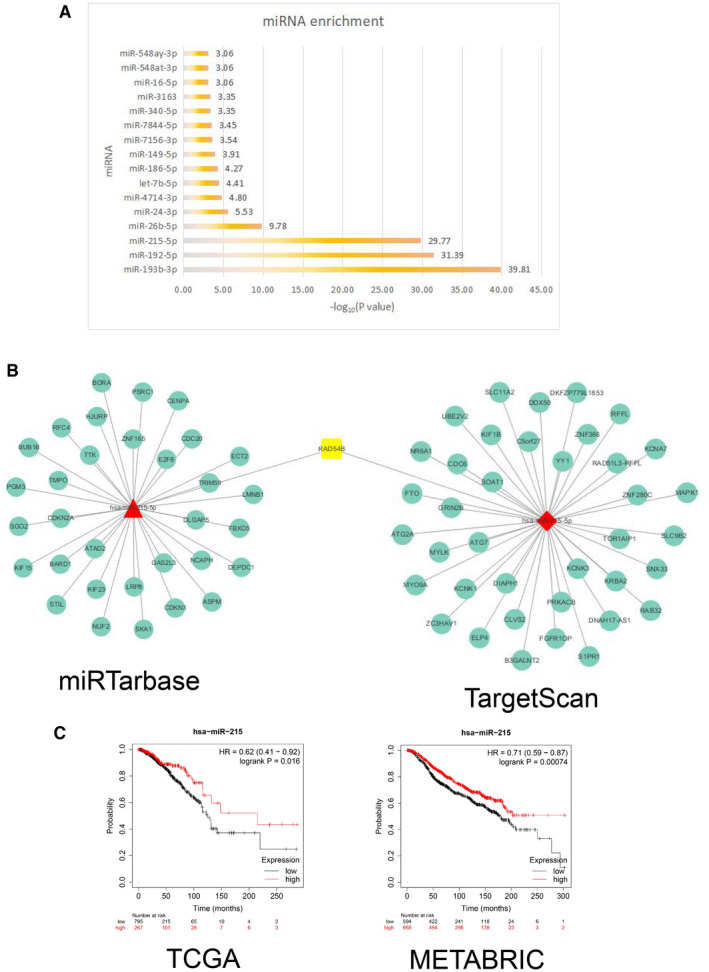
FIGURE 3.

(A) Histogram of miRNA enrichment analysis. The abscissa indicates −log10 (P value). (B) Prediction of miR‐215‐5p target gene network. The target genes of miR‐215‐5p were predicted in miRTarBase and TargetScan databases respectively. The RAD54B gene not only appeared in the intersection gene in Figure 2, but also appeared in the two prediction results. (C) Kaplan–Meier analysis of overall survival. miR‐215 was used for survival analysis of breast cancer samples in the TCGA database and METABRIC database. The results showed that patients in the group with high miR‐215 expression had a longer survival time
