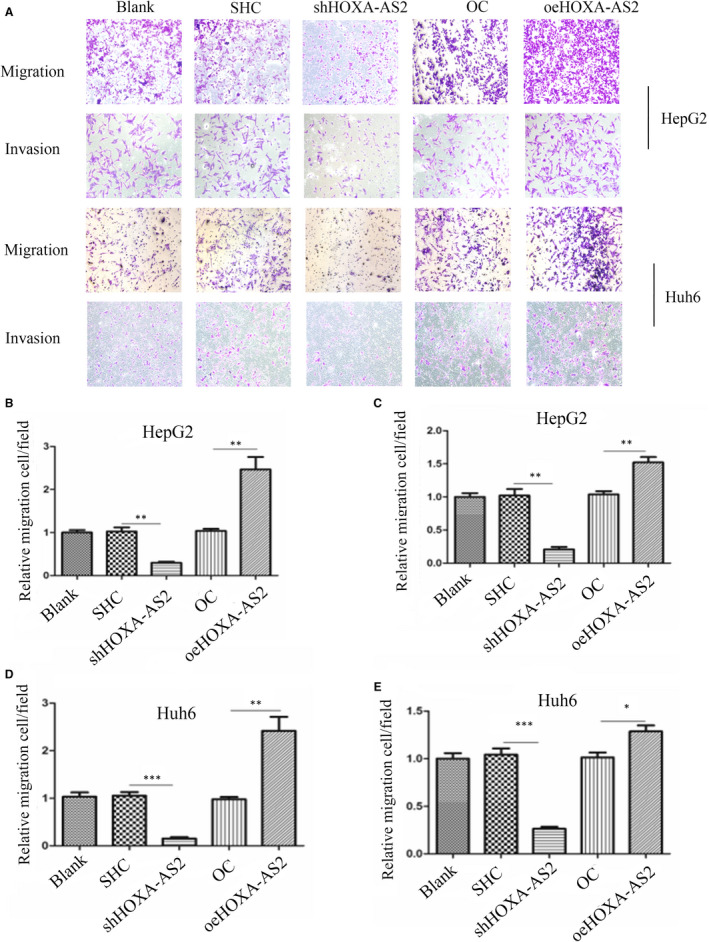
FIGURE 4.

Silencing of HOXA‐AS2 expression inhibited HB cells migration and invasion. A, Transwell assays demonstrating the effect of HOXA‐AS2 down‐regulation or up‐regulation on migration and invasion in HepG2 and Huh6 cells, the microscope magnification is 100×; B, C, statistics on the relative number of migration and invasion cells in HepG2; D, E, statistics on the relative number of migration and invasion cells in Huh6. Data shown represent the average and SD of three independent experiments. *P < .05; **P < .01; ***P < .001
